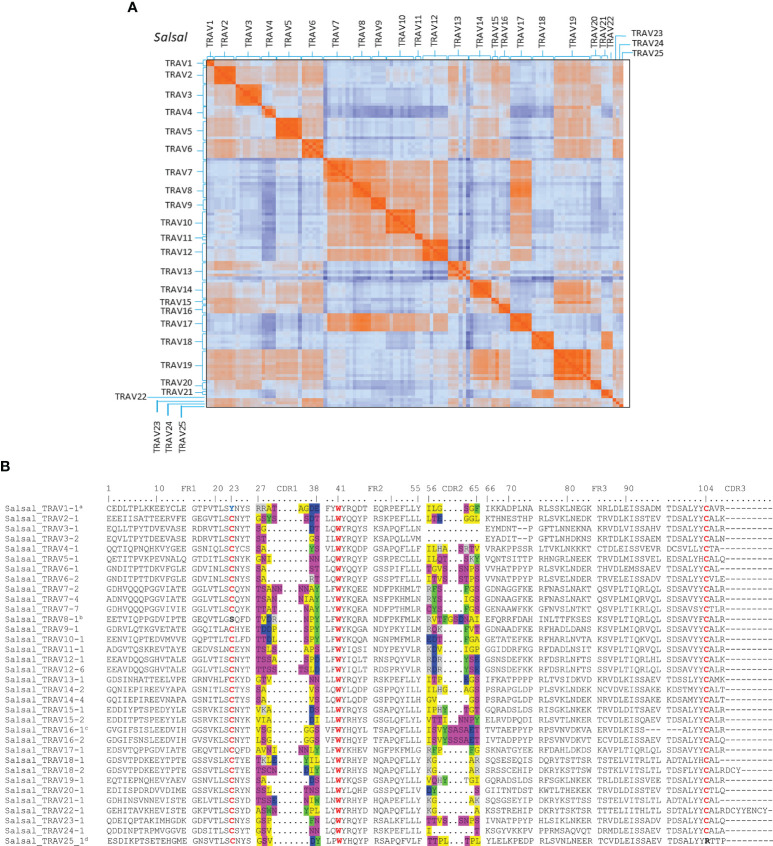
Figure 4.
Comparison of TRAV sequences from Atlantic salmon. (A) Heatmap representation of pairwise distance matrix of functional and ORF TRAV. Pairwise distances were estimated from amino acid alignments using the Poisson model. 103 functional TRAV and 12 ORF (TRAV4-2, TRAV4-4, TRAV5-7, TRAV6-3, TRAV7-1, TRAV8-5, TRAV10-3, TRAV10-5, TRAV12-3, TRAV13-4, TRAV13-6 and TRAV14-1) were included in the analysis. Color in each pixel indicate pairwise distance among and between each TRAV sequence. (B) Multiple Alignment of representative TRAV subgroups for Atlantic salmon (‘Salsal’ in the IMGT 6-letter abbreviation for genus and species). The CDR1 and CDR2 encoded amino acids are colored as follows: gray positively charged R groups, blue negatively charged R groups, green aromatic R groups, pink polar uncharged R groups, yellow nonpolar R groups, red conserved cysteines (1st-CYS 23 and 2nd-CYS 104) and conserved tryptophan 41. a Conserved 1st-CYS 23 is replaced by a Tyrosine (Y). b Conserved 1st-CYS 23 is replaced by a Serine (S). c six amino-acid deletion in FR3 compared to the other genes of the subgroup. d Conserved 2nd-CYS 104 is replaced by a Arg.

