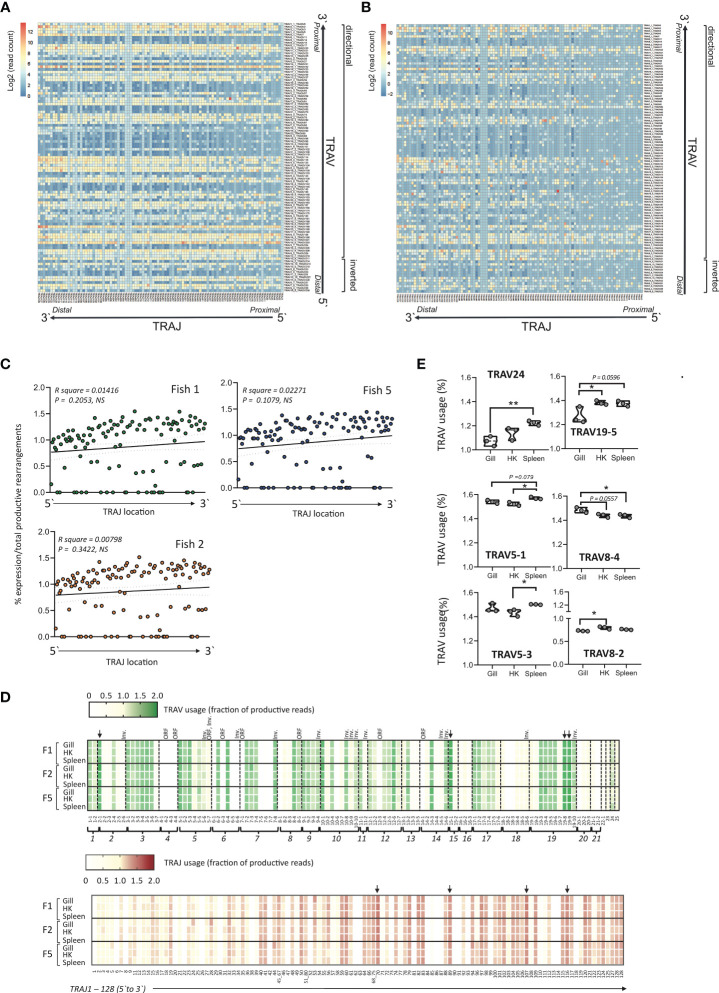
Figure 7.
Heat map of representative productive (A) or unproductive (B) TRAV- J combinations in Atlantic salmon. The average expression of TRAV-J combinations was computed from the TRA repertoire of the total number of productive sequences from gill, head kidney and spleen from three individual presmolt Atlantic salmon. The expression of each combination was expressed as total reads and the resulting matrix was normalized and represented as a heat map with a log2 count scale. TRAJ and TRAV genes are displayed as each gene appear in the genome following a 5`to 3`direction and the transcriptional direction of the TRAV genes is indicated. (C) Scatterplot of the relative expression of TRAJ genes versus genome location showing no significant correlation. The most 5` TRAJ corresponds to TRAJ1 and is located closest to the TRAC gene. The average of normalized expression frequencies in gill, HK and from three fish is shown. (D) TRAV and TRAJ usage in Atlantic salmon. TRAV and TRAJ usage was determined from deep sequencing datasets of C alpha (TRAC) primed 5`-RACE generated from gill, head kidney (HK) and spleen of three unvaccinated pre-smolt Atlantic salmon. TRAV and TRAJ usage in each individual and tissue was expressed as the percentage of total productive TRA rearrangements from normalized data sets. Inv. = inverted orientation of TRAV genes, ORF = open reading frame genes (TRAV4-2, TRAV4-4, TRAV5-7, TRAV6-3, TRAV7-1, TRAV12-3 and TRAV14-1), Downward pointing arrows indicating the four most frequently used TRAV (TRAV2-1, TRAV15-1, TRAV19-8 and TRAV19-9) and TRAJ genes (TRAJ70, TRAJ89, TRAJ107 and TRAJ116) common to all three fish. (E) Tissue preferential TRAV usage. The relative expression of specific TRAV genes in gill, Head kidney (HK) and spleen from three pre-smolt Atlantic Salmon were determined by comparing the normalized percentage of total productive TRAV rearrangements in each tissue among the three individuals, statistical significance was determined by one way ANOVA followed by Tukey’s multiple comparisons test with *p<0.05 and **p<0.01.

