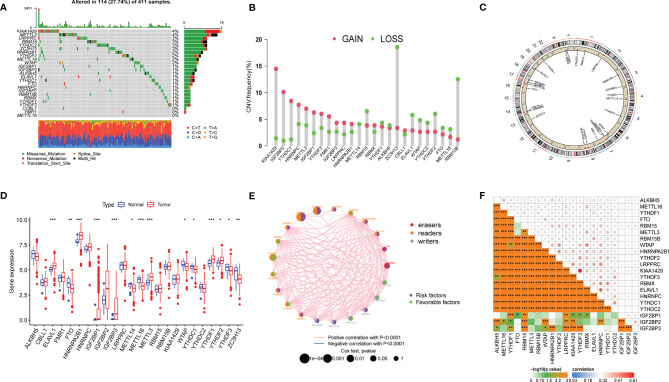
Figure 1.
Landscape of genetic mutation and transcriptome alteration of m6A regulators in bladder cancer. (A) 114 of 411 samples with bladder cancer experienced genetic mutations of 25 m6a regulators, with a frequency of 27.74. the presentation of each variant types was presented by the bagplots right barplots. Each cohort represented an individual sample. (B) The frequency of copy number variation in GSE32894 were presented. Green dot represented deletion frequency and the red dot represented amplification frequency. The number represented the variation frequency. (C) The location of CNV alteration of m6A regulators on 23 chromosomes were presented by circular diagram. (D) The expression level of 25 m6A regulators between tumor and normal samples. Red represented tumor and blue represented normal. The asterisks represented the statistical p value (*P < 0.05; **P < 0.01; ***P < 0.001). (E, F) The correlation among m6a regulators, red, orange and gray represented erasers, readers and writer respectively. The size of circle represented the effect of each regulator on clinical outcomes.

