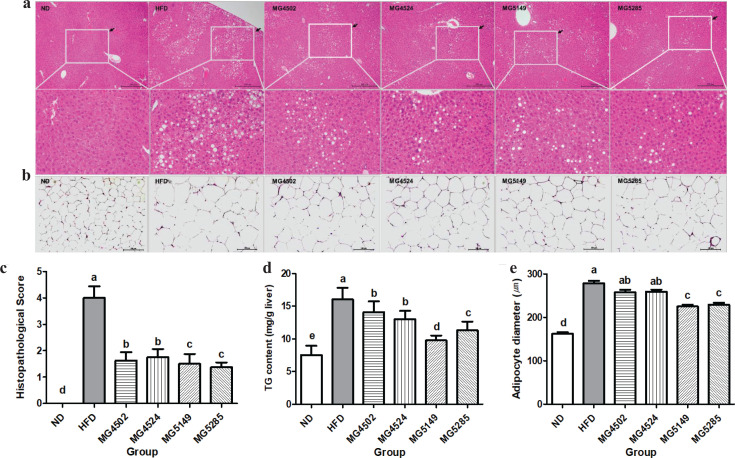
Fig. 3.
Histopathological changes in the liver and epididymal adipose tissue (AT) of HFD-induced obese mice. Representative photographs of hematoxylin and eosin (H&E)-stained sections (100 × magnification) of (A) liver tissue, (B) epididymal AT, (C) histopathological score, (D) triglyceride (TG) content, and (E) adipocyte diameter. The white square in the figure is an enlarged area where steatosis was induced. ND: normal diet, HFD: high-fat diet. Results are presented as the mean ± SD (n = 6). Different letters indicate significant differences between means at p < 0.05 by Duncan’s multiple range test.

