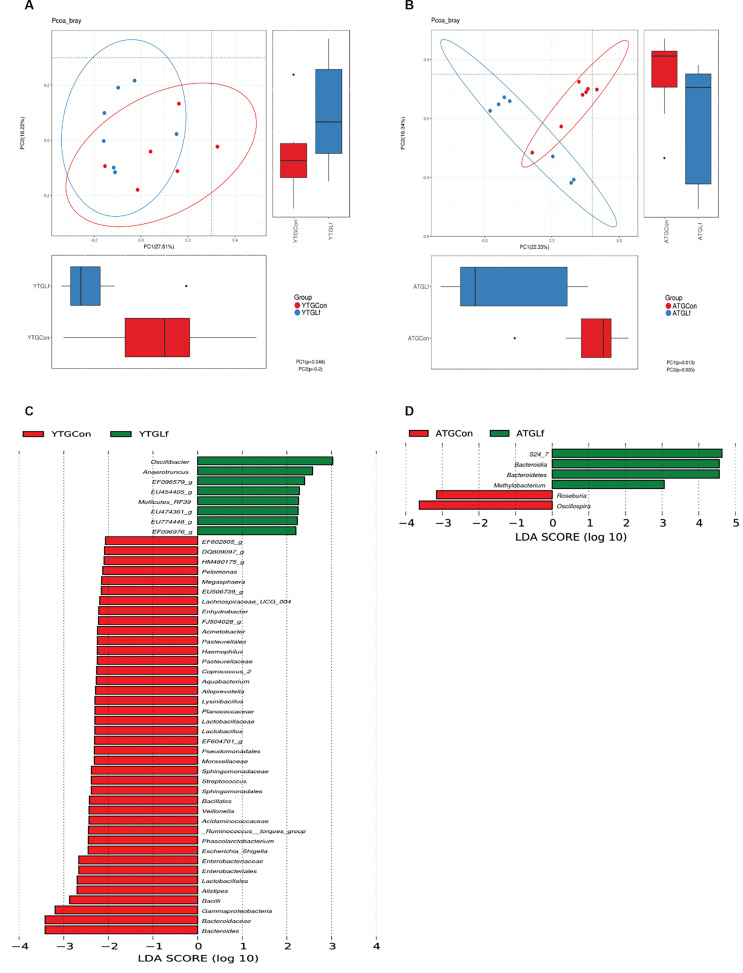
Fig. 6.
PCoA based on the abundance of OTUs and LEfSe analysis. Principal Coordinate Analysis (PCoA) for gut microbial composition in the young (a) and middle-aged (b) APP/PS1 mice were shown, with the first two principal components plotted to visualize UniFrac distances of cecal samples. Samples from TGCon and TGLf groups were depicted as red and blue, respectively for both the young and middle-aged mice. The bar graph indicated the taxa that discriminate between TGCon and TGLf groups in young (c) and middle-aged (d) APP/PS1 mice, respectively via LEfSe analysis. The statistical test was performed using the LDA effect size method. Only absolute LDA (log10) scores >2.0 were considered statistically significant.

