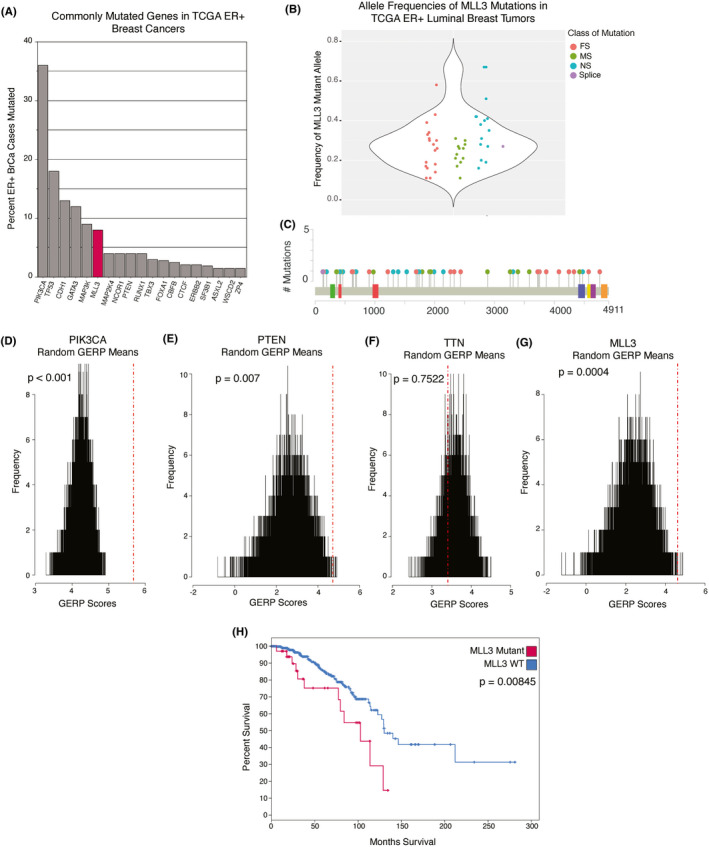
FIGURE 1.

MLL3 is significantly mutated in ER+ breast cancer; its mutation confers poor outcome. (A) The most commonly mutated genes in the provisional TCGA ER+ breast cancer RNA‐seq dataset (n = 581) BrCa = breast cancer. ER+ = estrogen receptor positive. (B) Frequency of mutant MLL3 allele in TCGA ER+ luminal breast cancer cases (n = 581). FS = frameshift. MS = missense. NS = nonsense. (C) MLL3 mutation lollipop plot of luminal TCGA breast cancer cases with RNA‐seq data (n = 46 mutations). Red lollipops indicate frameshift mutations, green indicates missense mutations, blue indicate nonsense mutations, and purple indicates splice mutations. Colored boxes indicate specialty domains as follows: PHD‐like zinc‐binding (green), PHD finger (red), F/Y‐rich N‐terminus (blue), F/Y‐rich C‐terminus (yellow), catalytic SET domain (purple). (D) Histograms of (#) simulations of averages of randomly chosen GERP scores in PIK3CA (E) PTEN (F) TTN and (G) MLL3. The number of randomly chosen GERP scores matches the number of mutations in each respective gene in the TCGA luminal breast cancer cases (n = 581). Simulated averages are shown by black lines, the actual average GERP score is shown by the red dotted line. P‐values are calculated by dividing the number of simulated averages higher than the actual average GERP score by the total number of simulated averages. (H) Survival curve showing luminal cases from TCGA breast cancer cohort (n = 581) that are either mutant (red) or wildtype (blue) for MLL3. Log‐rank Test p‐value = 0.00845. WT = wildtype
