FIGURE 5.

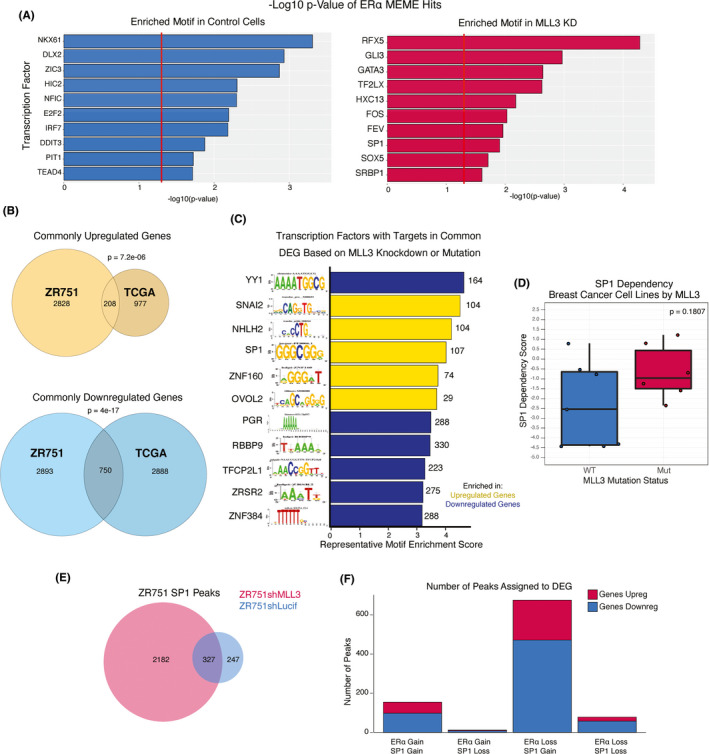
SP1 binding increases upon MLL3 KD in ER+ breast cancer cell line. (A) Representative enriched transcription factor motifs in ERα ChIP‐seq samples by MEME analysis. (n = 2 biological ChIP‐seq replicates per experiment) KD = knockdown. (B) Venn diagram of upregulated genes in the ZR751shLucif versus ZR751shMLL3 analysis as well as in the TCGA ER+ luminal breast cancer MLL3 WT versus MLL3 mutant analysis. Fisher's test, p = 7.2 × 10−06. Venn diagram of downregulated genes in the ZR751shLucif versus ZR751shMLL3 analysis as well as in the TCGA ER+luminal breast cancer MLL3 WT versus MLL3 mutant analysis. Fisher's test, p = 4 × 10⁻¹⁷. (n = 2 biological RNA‐seq replicates per experiment) (C) Representative enriched transcription factor motifs in the common differentially expressed genes between TCGA MLL3 WT versus mutants and ZR751 control and MLL3 KD cells, by iRegulon analysis in Cytoscape. (n = 2 biological RNA‐seq replicates per experiment) DEG = differentially expressed genes. (D) SP1 dependency scores of ER+ luminal breast cancer cell lines from the DEMETER tool where a lower score denotes a higher dependency. The center line signifies the median, box limits signify upper and lower quartiles, and whiskers signify the 1.5x interquartile range. All data points are shown as dots. Wilcoxon Rank Sum test, p = 0.1807 (n = 13 ER+ luminal breast cancer cell lines) (E) Venn diagram showing number of SP1 ChIP‐seq peaks in ZR751 control and MLL3 KD cell lines. (n = 2 biological ChIP‐seq replicates per experiment) (F) DEG upon MLL3 KD in ZR751 cells grouped into four categories based on the number of ERα and SP1 ChIP‐seq peaks assigned to each gene in the control and MLL3 KD conditions. (n = 2 biological ChIP‐seq replicates per experiment)
