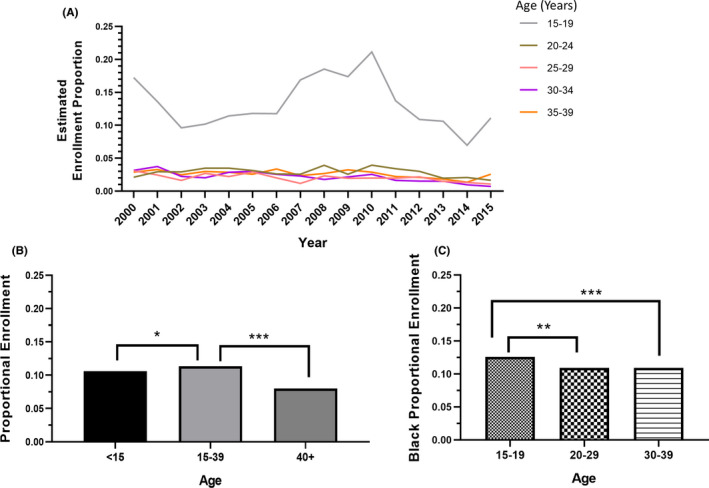
FIGURE 2.

Proportions of NCI‐sponsored CTT enrollees who were Black, 2000–2015. (A) Proportions of Black AYA enrollees, stratified by age, as estimated with SEER Program data. (B) Average proportions of Black pediatric (age <15 years), AYA (age 15–39 years), and older adult (age 40+ years) enrollees. (C) Average proportions of AYA enrollees who were Black, stratified by AYA age group. *p<0.05, **p<0.001, ***p<0.001.
