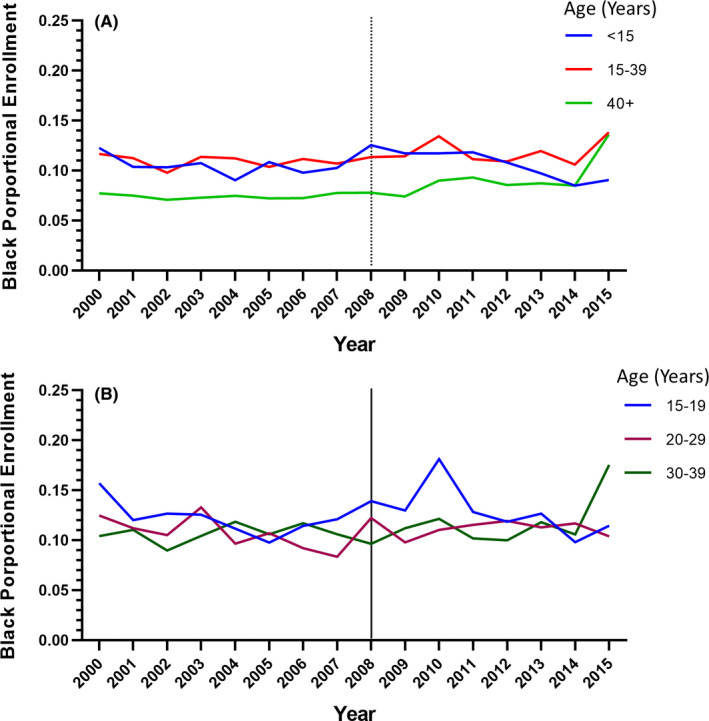
FIGURE 3.

Change in proportion of NCI‐sponsored CTTs enrollees who were Black, 2000–2015. (A) Change in proportion of pediatric (age <15 years), AYA (age 15–39 years), and older adult (age 40+ years) enrollees who were Black over time. (B) Change in proportions of AYA enrollees who were Black, stratified by age group, over time.
