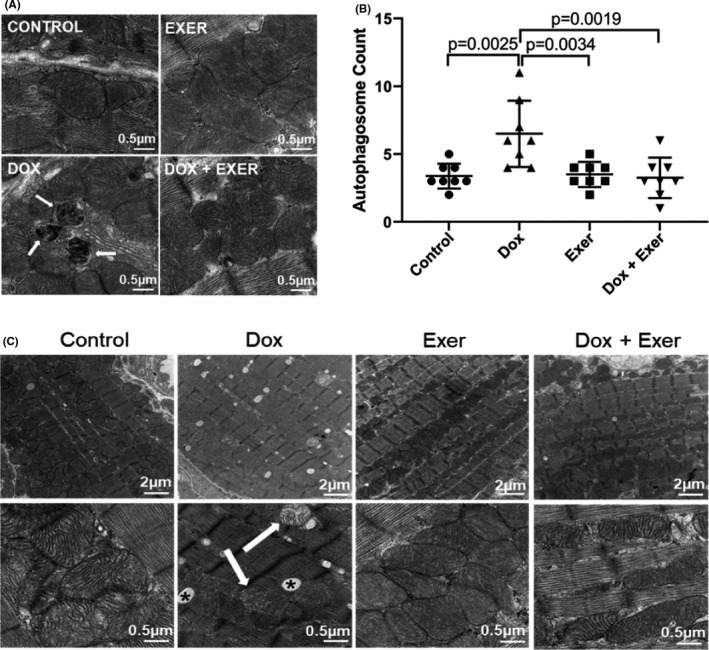
FIGURE 2.

Exercise inhibited doxorubicin‐induced autophagy and abnormal mitochondria in nude mice treated with Dox for 2 weeks. (A) Representative transmission electron microscopy (TEM) images of autophagosomes (arrow) 48 h after Dox therapy. (B) Quantitative analysis of autophagosomes. (C) Representative TEM images of abnormal mitochondria (arrow) and vacuolization (asterisk). n = 8 mice per group. Control versus Dox, p = 0.0025; Dox versus Dox + Exer, p = 0.0034 by one‐way ANOVA followed by Bonferroni test
