FIGURE 7.

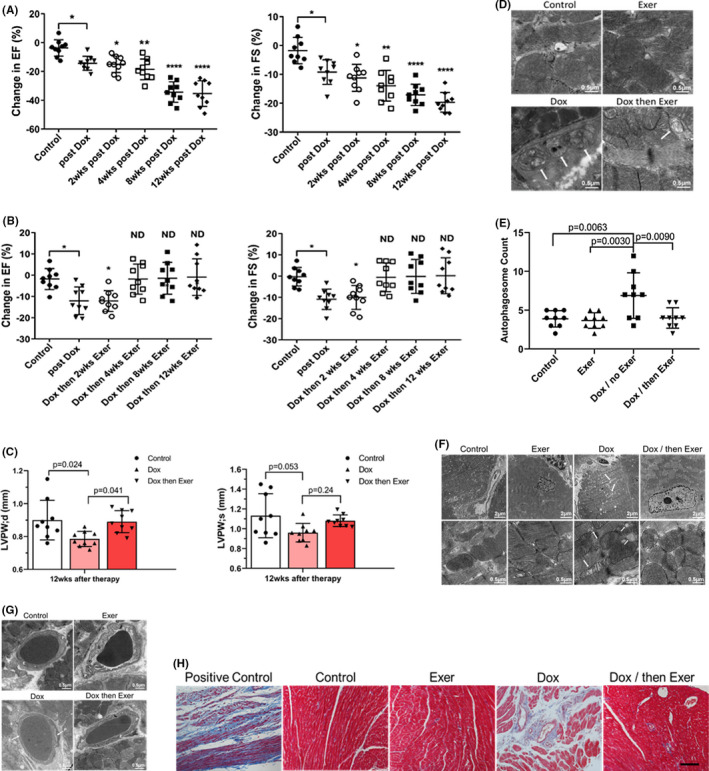
Exercise after doxorubicin (Dox) therapy inhibited long‐term Dox‐induced cardiotoxicity in nude mice. The data in Figure 7 were analyzed from the same experiment as that in Figure 6. There were six total groups in the experiment (Figure S1). The data were then presented to focus on the effect of exercise during therapy versus exercise initiated after therapy. The six individual groups in Figure S1 are Contro–l, Dox for 2 weeks and then no therapy; exercise for 2 weeks and then no therapy; and Dox + Ex for 2 weeks and. then no therapy in Figure 6. In Figure 7, the groups were from the same experiment but show the Control, Dox for 2 weeks and then no therapy; exercise for 14 weeks; and Dox for 2 weeks and then Exercise for 12 weeks. (A) Ejection fraction (EF) and fractional shortening (FS) were quantified by echocardiography 24 h after Dox therapy and then 2, 4, 8, and 12 weeks later. *p < 0.05. **p < 0.01. ****p < 0.0001. (B) EF and FS were quantified as in A in mice that exercised after Dox therapy. ND indicates no difference compared to control. *p < 0.05. (C) Left ventricular posterior wall thickness was measured in the diastole (LVPW, d) and systole (LVPW, s). In LVPW, d, control versus Dox, p = 0.024; Dox versus Dox and then Exer, p = 0.041. In LVPW, s, control versus Dox, p = 0.053; Dox versus Dox and then Exer, p = 0.24. Statistical analysis as described in Figure 2. (D) Representative transmission electron microscopy (TEM) images of autophagy (arrows). (E) Quantitative analysis of autophagosomes in the heart. (F) Representative TEM images of abnormal mitochondria (arrow) and vacuolization (asterisk) (the data from the six groups are shown altogether in Figure S4). (G) Representative TEM images of cardiac vessels (the data from the six groups are shown altogether in Figure S5). P indicates pericytes and E, endothelial cells. (H) Collagen deposition in the left ventricle was determined using Masson trichrome staining in mice that exercised after Dox therapy. Scale bar: 100 μm (n = 9 in each group)
