
FIGURE 2.
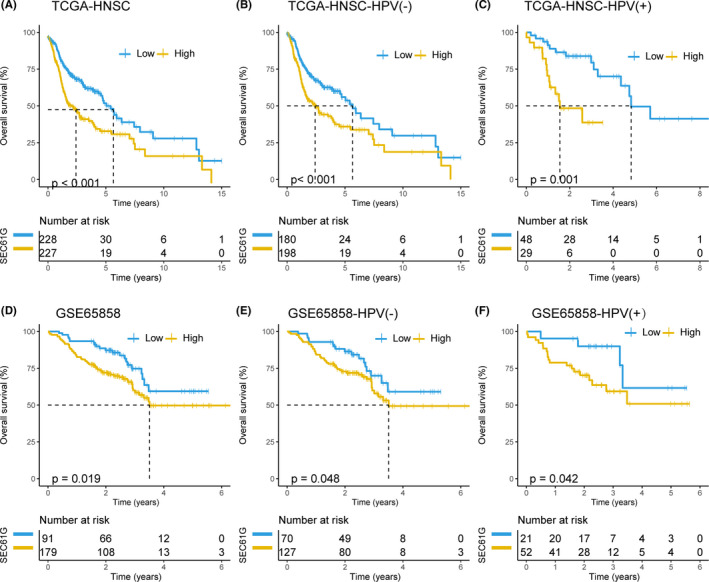
The prognostic values of SEC61G expression in HNSCC. (A) Overall survival curve of SEC61G in TCGA‐HNSCC (n = 445); (B) Overall survival curve of SEC61G in TCGA‐HPV (−) HNSCC (n = 378); (C) Overall survival curve of SEC61G in HPV (+) HNSCC from TCGA (n = 77); (D) Overall survival curve of SEC61G from GSE65858 (n = 270); (E) Overall survival curve of SEC61G in HPV(−) HNSCC from GSE65858 (n = 197); (F) Overall survival curve of SEC61G in HPV (+) HNSCC from GSE65858 (n = 73)