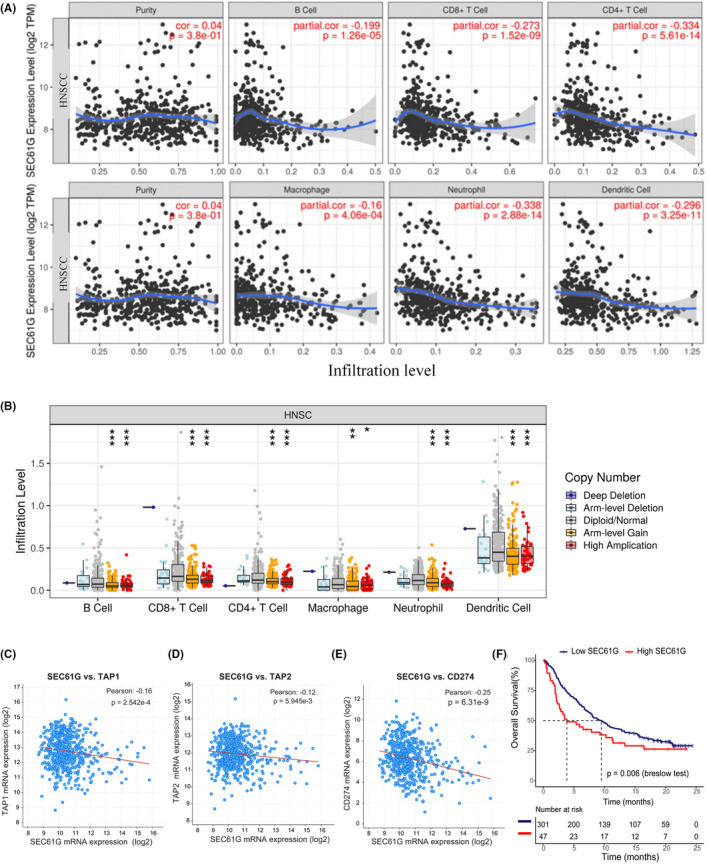
FIGURE 5.

The correlation of SEC61G expression and copy number variation with immune infiltrations in HNSCC. (A) The correlation between the infiltrations of immune cells and the expression of SEC61G via TIMER (Spearman's correlation); (B) The correlation between the infiltrations of immune cells and CNVs of SEC61G via TIMER (Wilcoxon rank‐sum test); (C) The negatively expressing correlation between SEC61G and TAP1 (Pearson correlation); (D) The negatively expressing correlation between SEC61G and TAP2 (Pearson correlation); (E) The negatively expressing correlation between SEC61G and CD274 (PD‐L1) (Pearson correlation); (F) Overall survival curve of SEC61G high‐ and low‐expression groups in metastatic urothelial cancer patients with atezolizumab; (*p < 0.05, **p < 0.01, ***p < 0.001)
