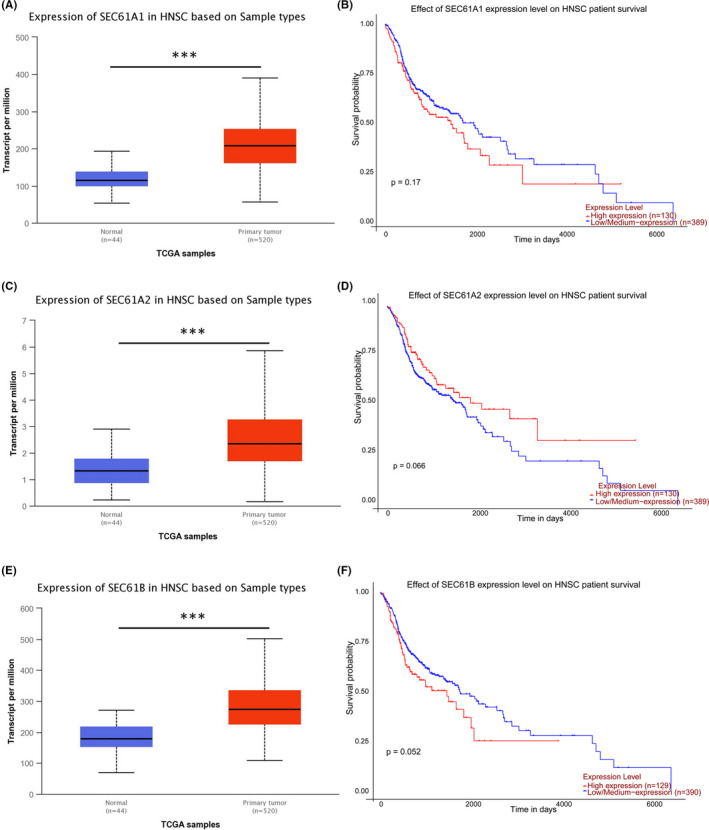
FIGURE 7.

The expression and prognostic value of the other subunits of the SEC61 complex in HNSCC: (A) SEC61A1 expression levels in HNSCC in TCGA; (B) Overall survival curve of SEC61A1 in TCGA‐HNSCC; (C) SEC61A2 expression levels in HNSCC in TCGA; (D) Overall survival curve of SEC61A2 in TCGA‐HNSCC; (E) SEC61B expression levels in HNSCC in TCGA; (F) Overall survival curve of SEC61B in TCGA‐HNSCC. (*p < 0.05, **p < 0.01, ***p < 0.001)
