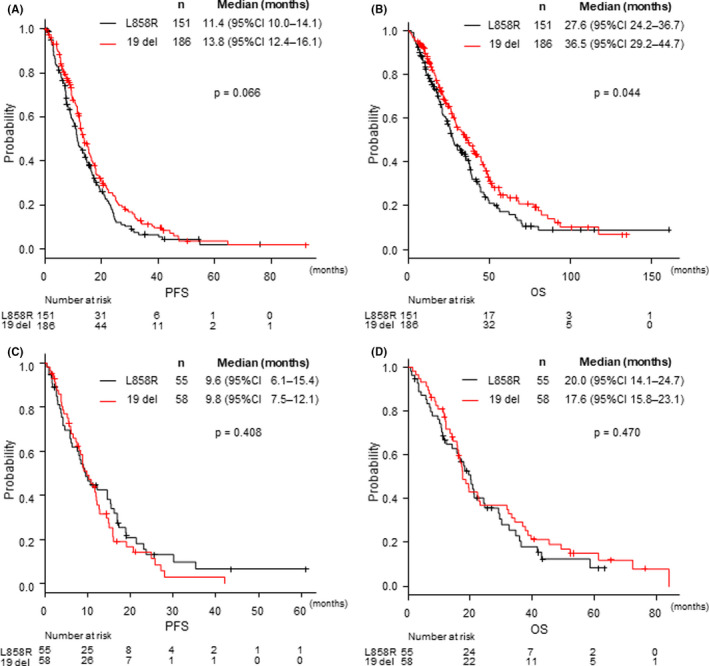
FIGURE 3.

Kaplan–Meier curves for (A) progression‐free survival and (B) overall survival in the AI fit group, and (C) progression‐free survival and (D) overall survival in the AI unfit group. AI, angiogenesis inhibitor; CI, confidence interval; HR, hazard ratio; OS, overall survival; PFS, progression‐free survival
