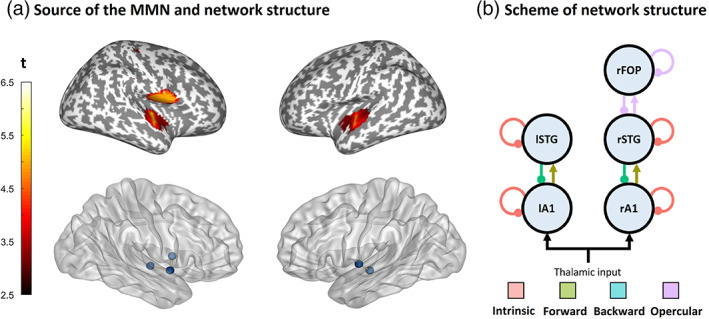
FIGURE 2.

Structure of the network. (a) Results of the source reconstruction (top) and prior location of the sources (bottom). (b) Scheme of the network. The connections modulated in each of the four model families are indicated with colors. The combination of these families yielded a total of 24 = 16 models, including a null model in which no connections were modulated. A1, primary auditory cortex; FOP, frontal operculum; STG, superior temporal gyrus
