FIGURE 5.

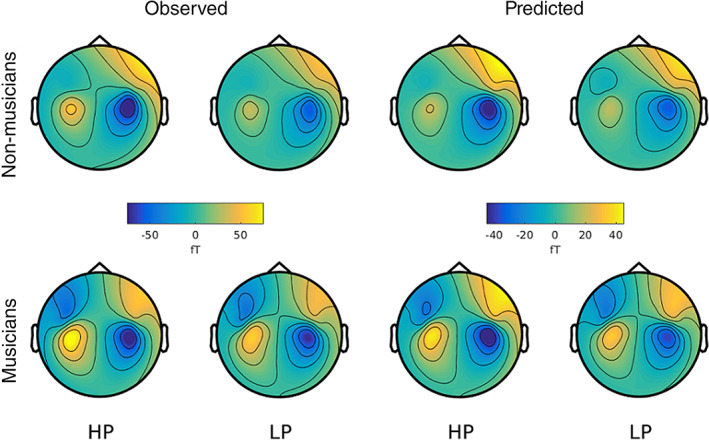
Topography of grand average MMNm responses (difference between deviants and standards) from 170 to 210 ms after sound onset, as observed in the experiment and predicted by DCM. HP, high predictability, LP, low predictability

Topography of grand average MMNm responses (difference between deviants and standards) from 170 to 210 ms after sound onset, as observed in the experiment and predicted by DCM. HP, high predictability, LP, low predictability