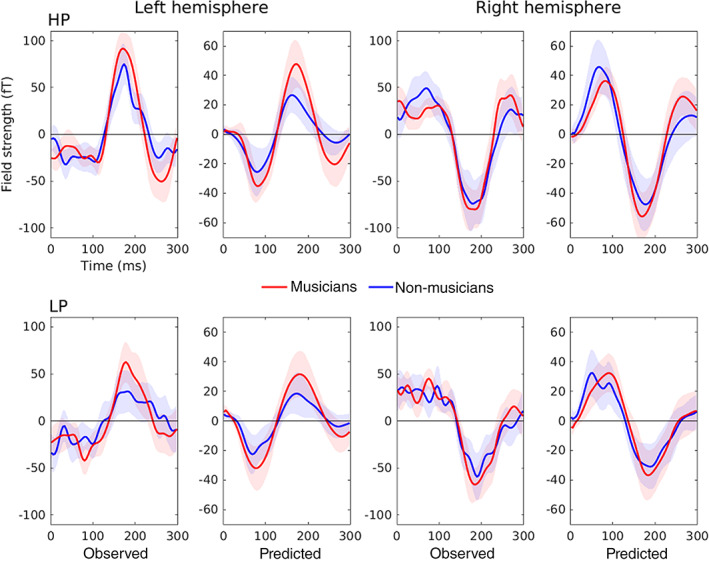
FIGURE 6.

Event‐related field of the MMNm (difference between deviants and standards) for each condition, group, and hemisphere, as observed in the experiment and predicted by DCM. The time courses correspond to the average of representative left (1611, 1621, 0231, and 0241) and right (2411, 2421, 1331, and 1341) auditory channels. Shaded areas depict 95% confidence intervals. HP, high predictability, LP, low predictability. Note that, while data were originally baseline corrected, for DCM they were mean centered as shown in the figure
