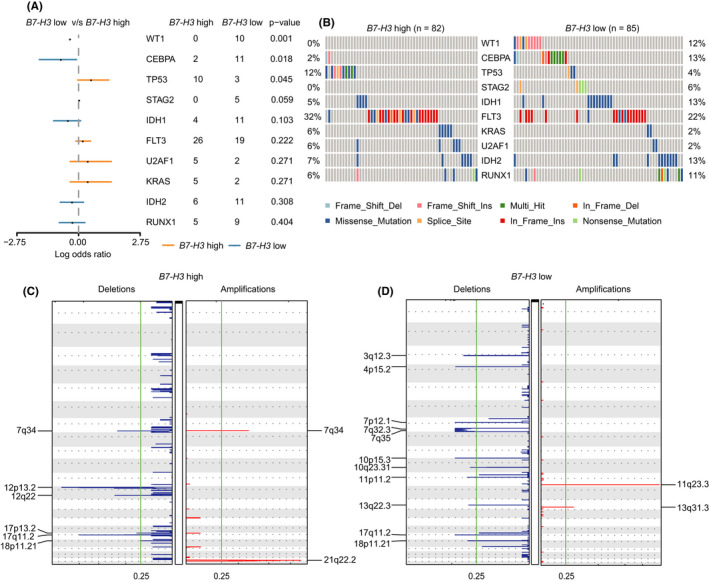
FIGURE 3.

B7‐H3 expression correlates with distinct genomic alterations in AML. (A) Forest plot showing the comparison of mutational profiles between patients with high and low B7‐H3 expression in the TCGA dataset. (B) Co‐onco plots showing the comparison of mutational profiles between patients with high and low B7‐H3 expression in the TCGA dataset. (C,D) GISTIC analyses identified recurrent copy number alterations in AML patients with high (C) and low (D) B7‐H3 expression
