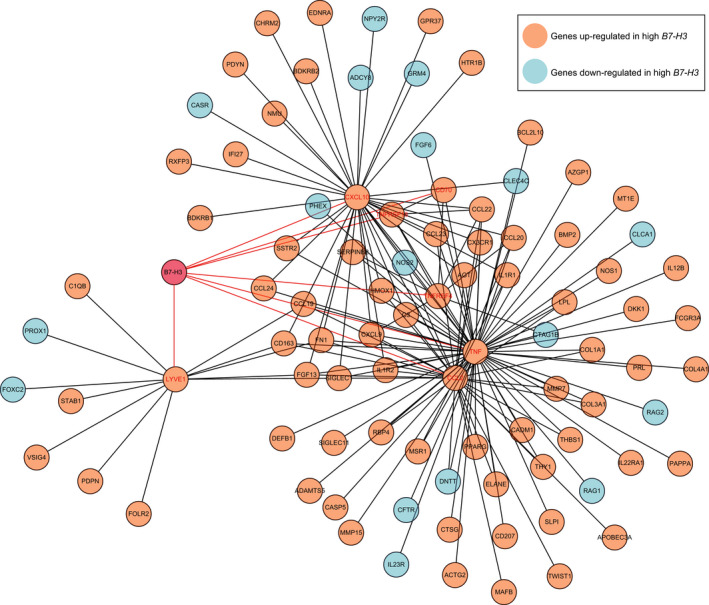
FIGURE 5.

Cytoscape analysis of B7‐H3‐related sub‐network using PPI information obtained from STRING database (http://stringdb.org/). Orange represents genes up‐regulated in high B7‐H3 expressers, while blue represents genes down‐regulated in high B7‐H3 expressers. Genes directly interact with B7‐H3 were marked in red
