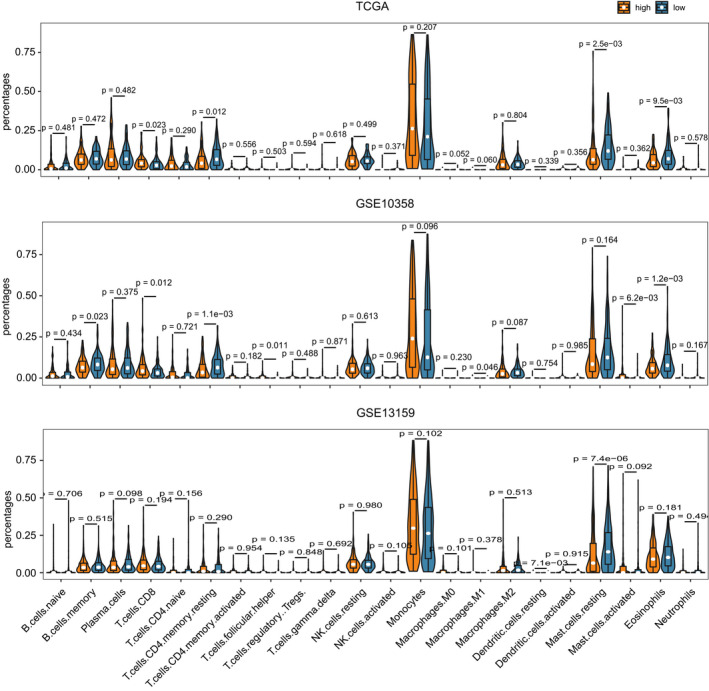
FIGURE 6.

The relation between B7‐H3 expression and immune cell infiltration. Violin plot showing the differences of immune cell fractions between patients with low and high B7‐H3 expression. The overall immune cell compositions were estimated by CIBERSORT across three datasets (TCGA microarray, GSE10358, and GSE13159)
