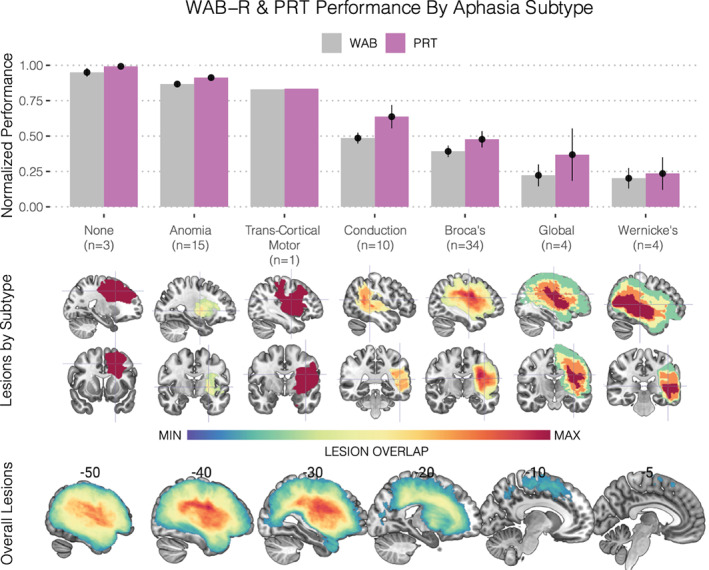
FIGURE 2.

Repetition performance by aphasia subtype. (Upper) Barplots and respective standard errors of the normalized behavioral performances for the two speech repetition tasks administered: (1) the Western Aphasia Battery—Revised (WAB‐R) subtest for repetition (shown in gray) and (2) the Philadelphia Repetition Test (PRT) (shown in violet). These scores were normalized by dividing them by the maximum. Bars are grouped according to their respective aphasia taxonomies and sorted in descending order based on performance. Given the strong correlation between these scores (r = .84), performance was averaged prior to subsequent analyses. (Middle) Lesion overlap maps for each subtype are displayed beneath the x‐axis with their respective crosshairs being centered on the center of mass to enable visualization. (Lower) Overall lesion overlap maps across the entire cohort are displayed along with their respective sagittal slice coordinates in MNI space
