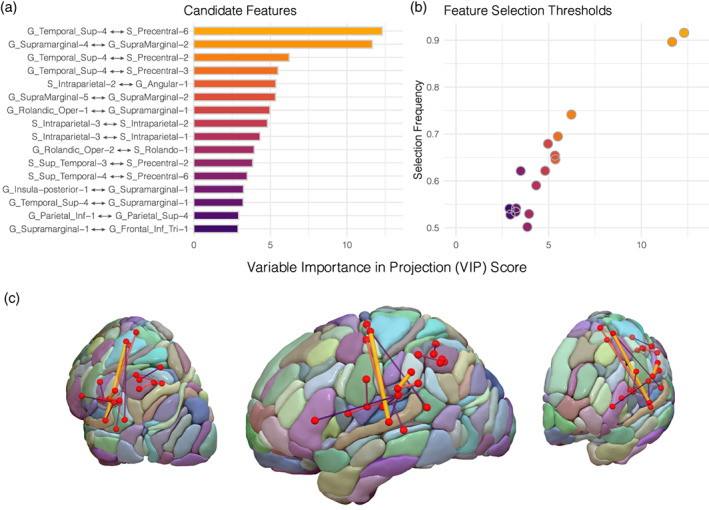
FIGURE 3.

Bootstrap‐VIP variable selection results. (a) Variable importance in projection (VIP) scores of the candidate features averaged across the 8,000 bootstrap resampling iterations of the sparse partial least squares regression (sPLS‐R) algorithm applied on 70% of the dataset. (b) Features surviving the “greater than one” VIP (x‐axis) and greater than 50% selection frequency (y‐axis) thresholds are plotted, resulting in 16 features for subsequent analysis. (c) The 16 features are displayed as edges and are overlaid onto the AICHA atlas. Edges are scaled in diameter according to their respective bootstrap‐VIP scores
