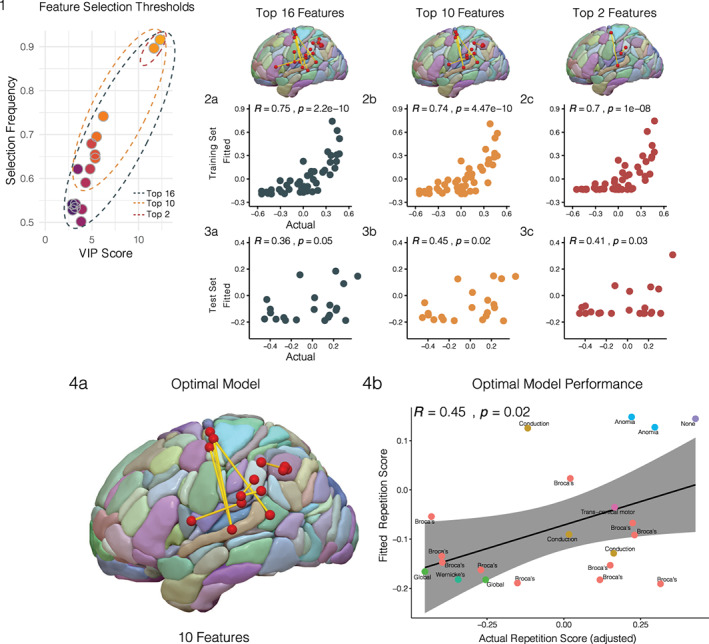
FIGURE 5.

PLS model selection. (1) Three connectomic PLS models were evaluated by applying progressively higher feature selection thresholds on the 16 candidate features: a model containing the complete set of 16 features (dark gray), a model containing the top 10 features (orange), and a model containing the top two features (red). (2) The three models were trained on the training set (n = 50) (2a–c) and their performances were evaluated on the held out test set (n = 21) using correlations computed between fitted and actual repetition scores for each respective model (3a–c). (4) On the basis of its predictive performance on the test set (R = 0.45, p = .02), the connectomic PLS model containing the top 10 features was chosen as the optimal model (4a). The actual versus fitted scores of the optimal model are plotted with respect to the aphasia subtypes present in the test set (4b)
