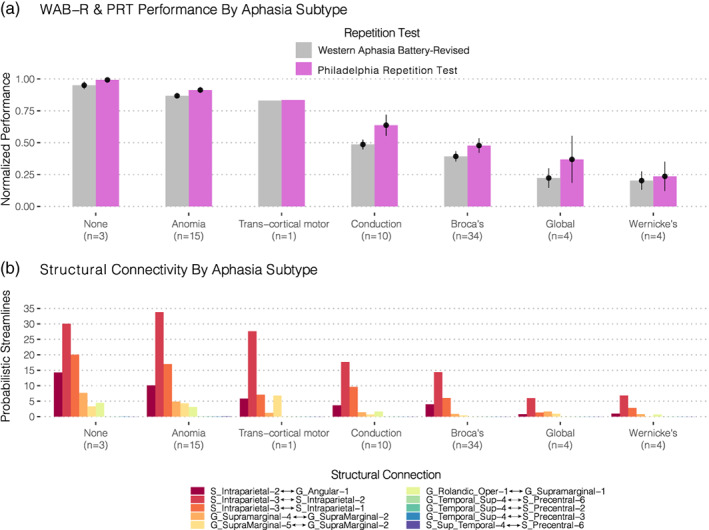
FIGURE 6.

Connectome‐Symptom Mapping. Using the same descending order shown and described in Figure 2, barplots of the normalized probabilistic streamline counts are shown across the entire group (N = 71) for each of the optimal 10 features identified. Both the behavioral patterns and structural connectivity measures show similar descending patterns across the aphasia taxonomies
