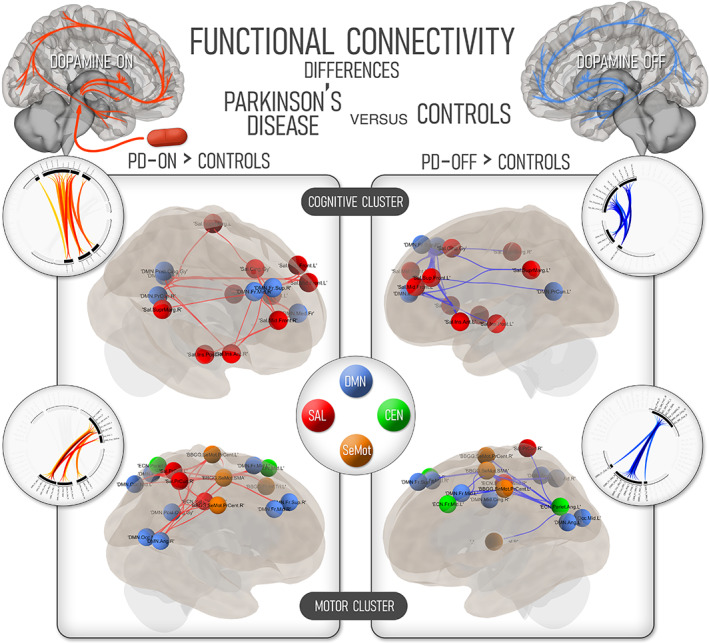
FIGURE 1.

Differences in functional connectivity between nondemented Parkinson's disease participants and healthy, age‐matched controls. The three large‐scale cognitive networks are considered on the upper renders (labeled “cognitive cluster”), while the changes in the three cognitive networks plus the sensorimotor network are showcased in the lower renders. On the left part of the image, regions with higher functional connectivity in the Parkinson's disease participants in the ON state are highlighted. Regions with higher connectivity compared to controls in the OFF state are shown in the right part of the image. The color code corresponding to the four large‐scale networks is shown in the central ring. CEN, central executive network; DMN, default‐mode network; SAL, salience network; SeMot, sensorimotor network; PD, Parkinson's disease
