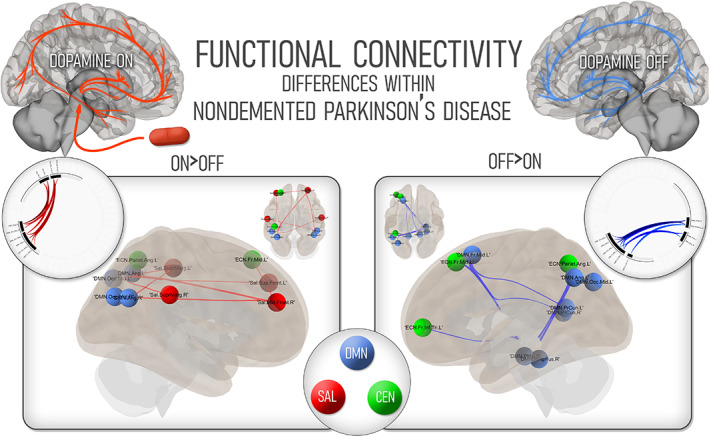
FIGURE 2.

Changes within nondemented Parkinson's disease participants according to medication status. On the left, regions which showed higher connectivity in PD participants in the ON state; on the right, regions showing higher connectivity in the OFF state. The color code corresponding to the three large‐scale cognitive networks is shown in the central ring. CEN, central executive network; DMN, default‐mode network; PD, Parkinson's disease; SAL, salience network
