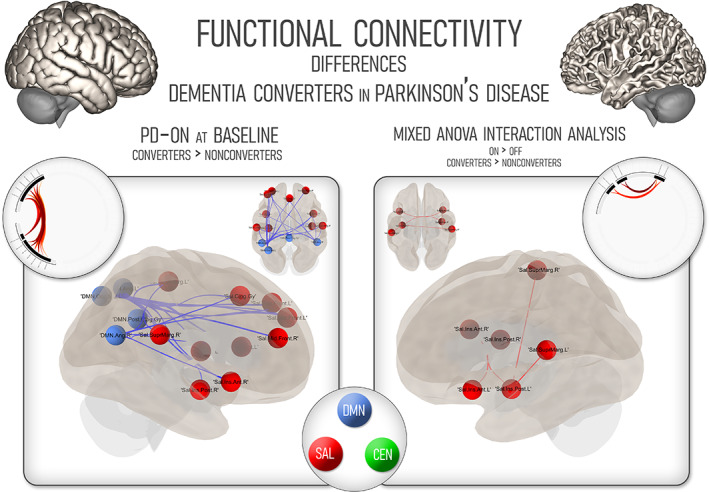
FIGURE 3.

Cognitive network changes in Parkinson's disease participants in a 10‐year follow‐up. On the left, changes in functional connectivity comparing converters to nonconverters using baseline scans in the ON state. On the right, mixed interaction analysis according to both conversion to dementia and medication state. CEN, central executive network; DMN, default‐mode network; PD, Parkinson's disease; SAL, salience network
