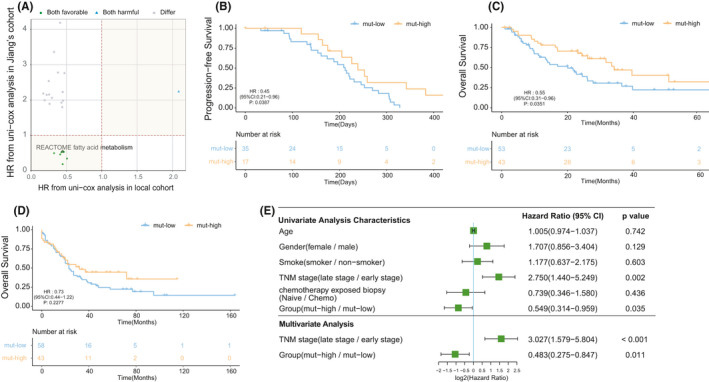
FIGURE 2.

Fatty acid metabolism‐related mutations were associated with the prognosis of SCLC patients receiving chemotherapy. (A) Patients were grouped based on the median frequency of pathway mutations in their corresponding cohort, and the scatter plot shows the HRs of different pathways from the local hospital cohort and Jiang's cohort. All the points in the plot represent a pathway with p < 0.05 in the univariate Cox regression, and the green, blue, and gray dots indicate the pathways that were associated with better, worse, and different patient prognoses in the two cohorts, respectively. (B) Kaplan–Meier survival curves of the PFS of the local hospital cohort comparing patients in the mut‐high group and the mut‐high group. (C) Kaplan–Meier survival curves of the OS of Jiang's cohort comparing patients in the mut‐high group and the mut‐high group. (D) Kaplan–Meier survival curves of the OS of the George's cohort comparing patients in the mut‐high group and the mut‐high group. (E) Univariate and multivariate analyses in Jiang's cohort. (A–D) Differences between the mut‐high and mut‐high groups were assessed using univariate Cox analysis
