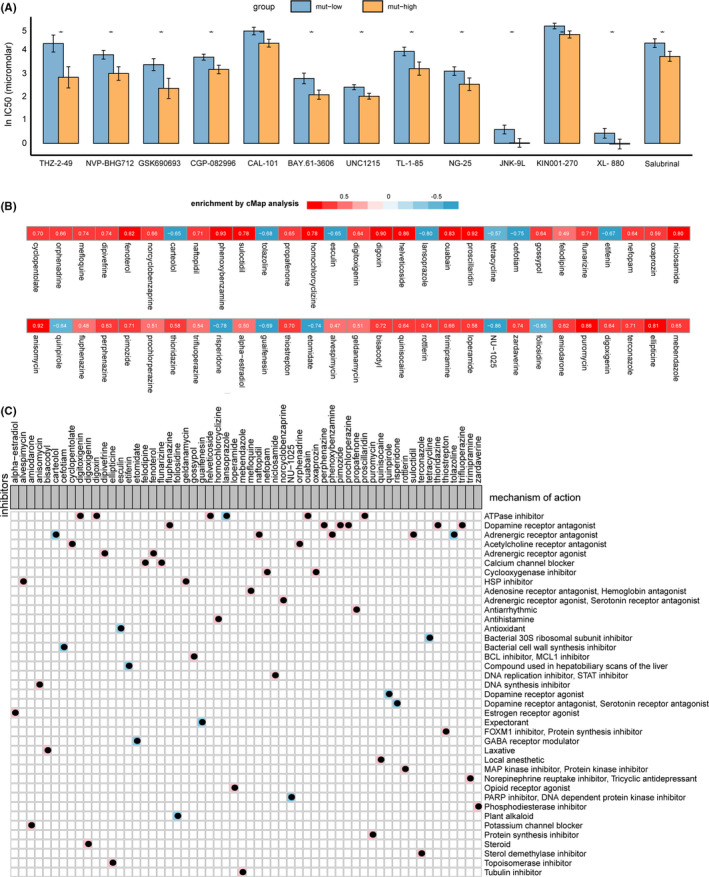
FIGURE 5.

Comparison of drug responsiveness between the mut‐high and mut‐low groups and the results of CMap analysis. (A) LnIC50 values of drugs between the mut‐high group and the mut‐low group. The IC50s reported in the GDSC database were log transformed. The differences in the lnIC50 values of different drugs between the mut‐high and mut‐low cell lines were tested using the Mann–Whitney U test. ns: not significant; *p < 0.05; **p < 0.01; ***p < 0.001. (B) Heatmap showing the enrichment score of each drug from the CMap analysis for cell lines in the GDSC database. Blue corresponds to a negative enrichment score; red corresponds to a positive score. (C) Heatmap showing the drugs from the CMap analysis that share an MoA. The background colors (blue and pink) correspond to negative and positive enrichment scores, respectively
