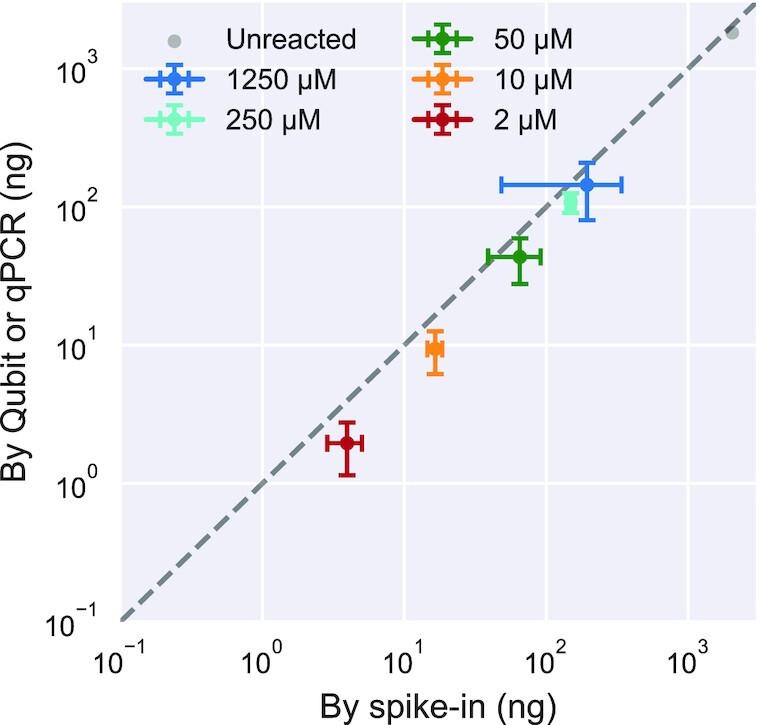
Figure 3.

Comparison of RNA quantitation methods for k-Seq. Total RNA amount
quantified for samples incubated with different BYO concentrations, determined by
spike-in method vs. direct quantification using Qubit or qPCR, correlates well
(Pearson's r = 0.999, P-value =
 ) and with
comparable relative standard deviation (Supplementary Figure S2). Error bars show standard deviations
calculated from triplicates for reacted samples.
