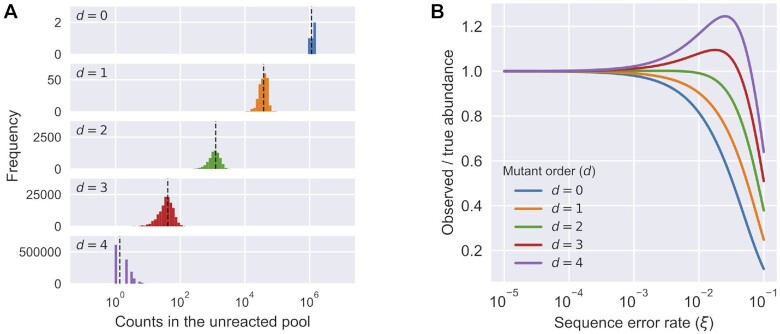
Figure 4.
Distribution of mutants in the pool and the effect of sequencing error.
(A) Relative abundance (counts) of sequences in the unreacted pool
(four ribozyme families, total number of reads = 32 931 917), categorized by Hamming
distance to its nearest family center. Observed abundance of different classes was
similar to the expected number of counts (black dashed line). (B) The
effect of different levels of sequencing error ( ) to the expected
observed abundance as the ratio to the true abundance for mutants with different
orders (
 ) in a variant pool with 9% mutation
rate. Due to the mixed effects of losing counts from being misidentified to a
neighboring sequence and gaining counts from the misidentification of a neighboring
sequence, the observed abundance for a sequence would either decrease
(
 ) or first increase then decrease
(
 ) as the sequencing error
increases. See Supplementary Text
S3 for calculation details.

