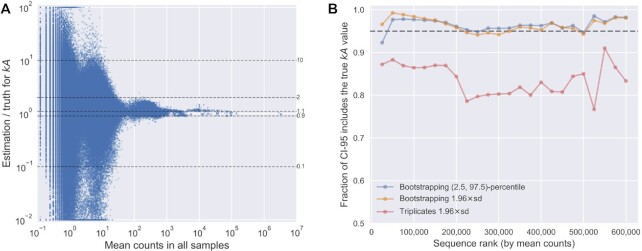
Figure 5.
Accuracy of parameter estimation by k-Seq. (A)
Dependence of accuracy (ratio of estimated  to true
 ) on mean counts across all simulated
samples (including the unreacted pool sample). The dashed lines correspond to ratios
as labeled. Ratios >100-fold or <0.01-fold are shown at the borders of the plot.
(B) Fraction of sequences for which the CI-95, estimated using
bootstrapping or using triplicates, includes the true
  values,
for sequences with different mean counts across all samples. Sequences were ranked by
mean counts (from highest to lowest) and binned in sets of 25 000 sequences. Each data
point indicates the fraction of CI-95 that includes the true values in each bin.

