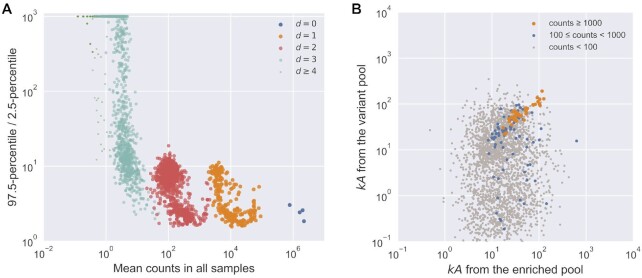
Figure 6.
Precision of estimation by k-Seq. (A) Fold-range
(97.5-percentile/2.5-percentile) of  estimation depended
on the mean counts. Increasing mean counts increases precision, as shown by the
relationship of fold-range with mean counts across different orders of mutants. For
 , only 1000 sequences were
randomly selected for visualization. (B) Alignment between estimated
 from two independently conducted
experiments (experiment from (2), and the
k-Seq experiment reported here). Only sequences with 2.5-percentile
higher than baseline catalytic coefficient (
 ,
reported in (2)) were included. Each point
represents a sequence whose color reflects the minimum of mean counts (between two
experiments).

