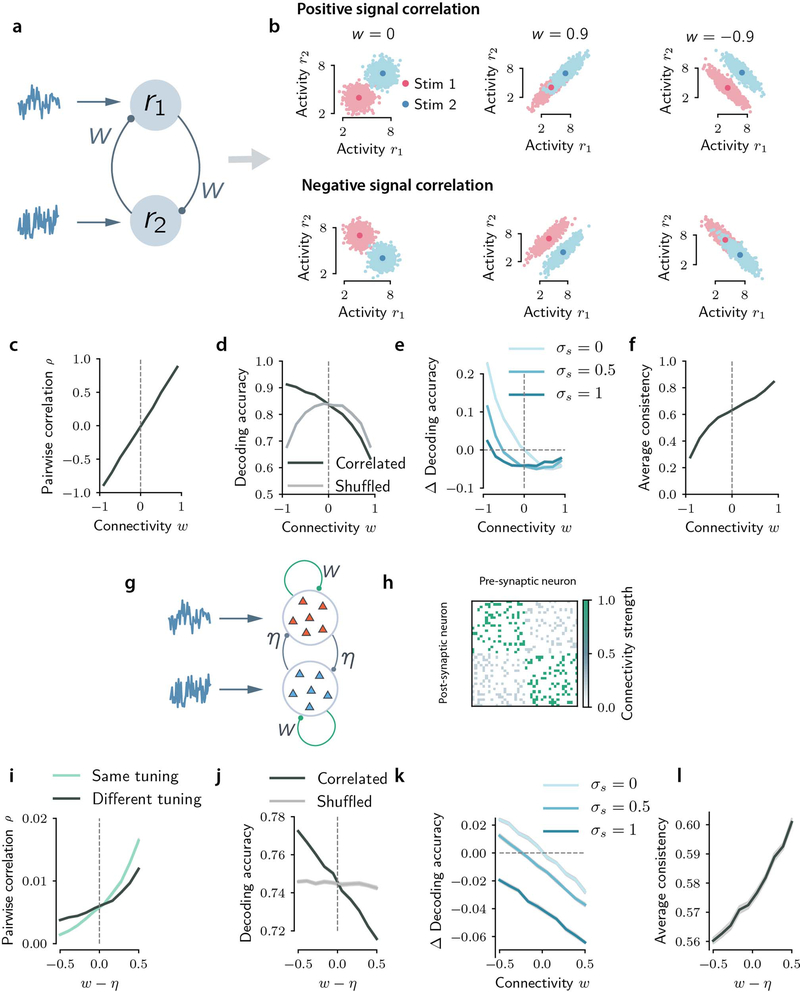
Extended Data Figure 9: Encoding model internally generating correlated activity through recurrent dynamics.
a, Schematic illustrating the basic setup of the encoding recurrent model. Two neurons receive stimulus-dependent feedforward input (which determines the signal correlations) and input noise, and are connected through recurrent synapses with strength w. b, Noise correlations are generated through recurrent connectivity, and depend on the sign of w (for w = 0 responses are uncorrelated). Top: for positive signal correlations, positive (resp. negative) values of the connectivity generate information-limiting (resp. information-enhancing) noise correlations. Bottom: for negative signal correlations, positive (resp. negative) values of the connectivity generate information-enhancing (resp. information-limiting) noise correlations. c-f, Average pairwise noise correlation (over n=10000 random pairs of neurons) (c), decoding accuracy for correlated and shuffled responses (d), difference in decoding accuracy between correlated and shuffled responses for different values of shared noise (e) and average consistency (f) as a function of connectivity strength w. In c,d,f the external input noise is uncorrelated across the two neurons. g, Schematic illustrating the 2N-dimensional encoding recurrent model. Two N-dimensional neuronal groups with opposite stimulus selectivity receive stimulus-dependent feedforward input and input noise. The connectivity strength is excitatory, sparse and takes the value w > 0 between neurons belonging to the same group, and η > 0 between neurons belonging to different groups. h, Example of a connectivity matrix adopted in these analyses. All matrix entries are positive (excitatory synapses) and sparse with connection probability p. i-l Same quantities computed in c-f as a function of the difference between the within-group connectivity and between-groups connectivity strength, w − η. We set N = 50, p = 0.5, η = 0.5. In c-f, i-l data are presented as mean ± SEM over n=50 simulations.

