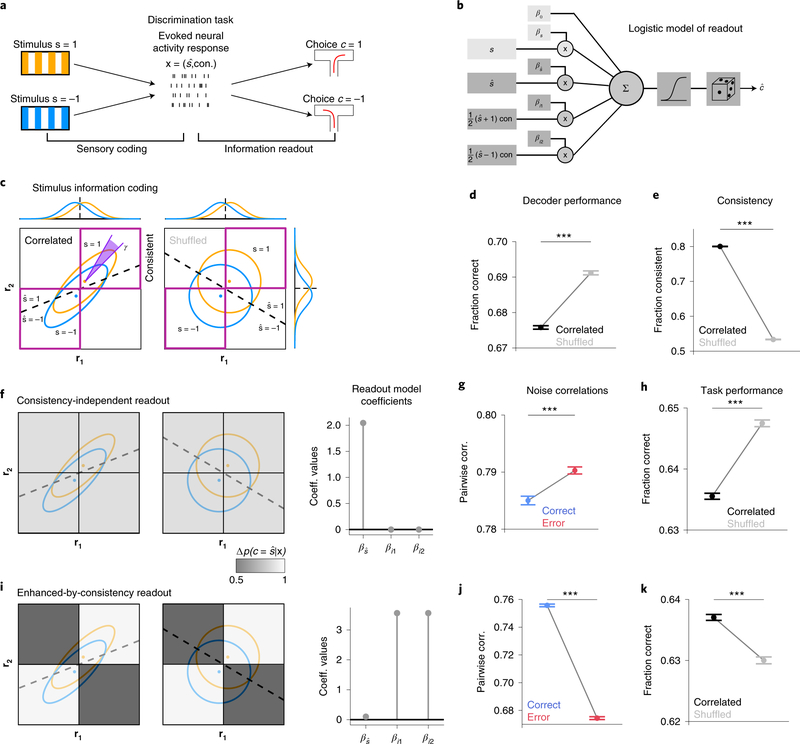
Figure 2: A simple encoding-readout model shows how different readouts determine the impact of correlations on task performance.
a, Schematic conceptualizing two fundamental information processing stages in sensory perception included in the model: sensory coding (mapping from sensory stimuli to neural activity) and information readout (mapping from neural activity to behavioral choice). Task-relevant neural activity is recapitulated by the stimulus predicted from population activity () and its consistency across features (con). b, Schematic of the readout model used to model choices. Non-neural predictors (bias and real stimulus, light gray boxes on the left; used only in real data analyses to account for the effect of non-recorded neurons) and neural predictors (stimulus predicted and consistency, dark gray boxes on the left; used both in simulations and data analyses) are weighted, summed and transformed through a sigmoid function that outputs the binomial probability of a binary choice.
c, Example of simulated response distributions of two one-dimensional neural features (r1, r2) to two stimuli (s=1, s=−1), modelled as bivariate Gaussians. For the correlated example, noise and signal axes are closely but not perfectly aligned (γ=0.08π). Ellipses: 95% confidence intervals of stimulus-specific activity distributions. Dashed black line: optimal stimulus decoding boundary. Purple squares: regions in which r1 and r2 encode consistently stimulus information, i.e. the same stimulus is decoded from both. Marginal response distributions and decoding boundaries are shown sideways. d, Accuracy of a linear decoder of stimulus applied to simulated responses is higher for uncorrelated responses (correlations limit the encoded stimulus information). e, The fraction of trials in which r1 and r2 encode consistent stimulus information is higher for correlated responses (correlations increase consistency).
Panels f-h refer to the consistency-independent readout. f, The readout is represented as a grayscale map in the r1-r2 response space. Orange and blue ellipses: stimulus-specific distributions. Shade of gray: readout efficacy (probability of transformation from encoded stimulus to choice), which for this readout is independent of consistency. The corresponding readout model regression coefficients are shown on the right ( for the predicted stimulus, and βi1 βi2 for the consistency-dependent interaction terms between predicted stimuli and neural consistency). g, Pairwise noise correlations are higher in error trials. h, Task performance computed using this readout model is higher for uncorrelated responses.
Panels i-k refer to the enhanced-by-consistency readout (consistency modulation index η = 0.9, see Methods). i, Same as f. The readout efficacy is higher for consistent trials. j, Same as g. Pairwise noise correlations are higher in correct trials. k, Same as h. Task performance is higher for correlated responses, indicating that this readout overcomes the information-limiting effect of correlations.
In panels d, e, g, h, j, k errorbars report mean ± SEM over 200 simulations with 5,000 trials each with N=1, γ = 0.08π, , σ = 0.2. Correlated: ρ=0.8, equivalent to ν=0.9. Uncorrelated: ρ=0, equivalent to ν=0.5. For all comparisons, P=10−4, two-sided permutation test. Model parameters were purely illustrative and did not match real data.

