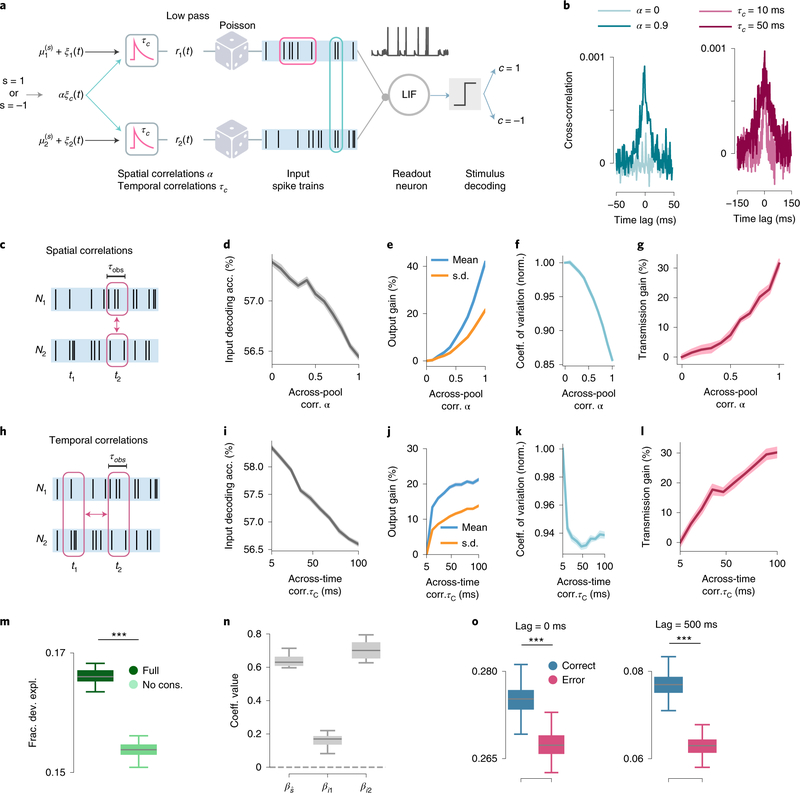
Figure 6: A biophysical model for the enhanced-by-consistency readout.
a, Schematic of the model. A leaky integrate-and-fire (LIF) readout neuron receives stimulus-modulated spike trains from two input pools. A linear stimulus classifier of the readout activity generates the transmitted output c. b, Cross-correlograms of the two input spike trains for different values of the across-pool (left) and across-time (right) correlation parameters α and τC (mean input rate Rin = 2Hz). c, Schematic illustrating across-pool correlations between the input activity. τobs is the length of each simulated trial. d, Input stimulus decoding accuracy as a function of the across-pool correlation strength α. e, Mean and standard deviation of the readout activity (normalized to their reference value in absence of correlations) as a function of α. f, Coefficient of variation (CV) of the readout activity as a function of α, normalized by its value in absence of input correlations. g, Gain in the stimulus information transmission from the input to the readout neuron (Eq. (S9), Supplementary Mathematical Note S5) as a function of α. In d-g τm = 5ms, Rin = 2Hz, τC = 100ms. All the quantities were computed on the input or output spike counts measured on time windows of length τobs h, Schematic illustrating across-time correlations between the input activity at two different time points t1 and t2. i-l, The quantities as in d-g showed similar trends when computed as a function of the across-time correlations τC. In i-l τm = 5ms, Rin = 2Hz, α = 0.9. In d-l data are presented as mean ± SEM over n=20 simulations. m, Time-lagged pairwise noise correlations computed separately on correctly-transmitted and incorrectly-transmitted simulated trials, across time lags of 500mmss. (for 0ms time lag P = 1.72 × 10−117, t=33.4, [−1.65,1.65], for 500ms time lag P = 1.24 × 10−195, t=57.8, [−1.65,1.65]; two-sided t-test, n=200 independent sets of equalized correct and error trials). n, Fraction of deviance explained for the model choices (output of the stimulus classifier on readout neuron’s activity) for the enhanced-by-consistency and the consistency-independent readout regressions (P = 4.58 × 10⁻²³, t=21.8, [−1.69,1.69], two-sided t-test, n=20 independent sets of equalized correct and error trials). o, Values of the coefficients of the enhanced-by-consistency readout regressions. The coefficients , βi1 and βi2 correspond respectively to the stimulus decoded regressor and the two consistency regressor (Methods). In m-o boxplots show the median (line), first and third quartiles (box), and whiskers extend to ±1.5*interquartile range; in simulations τm = 5ms, Rin = 6Hz, α = 0.9, τC = 500ms.

