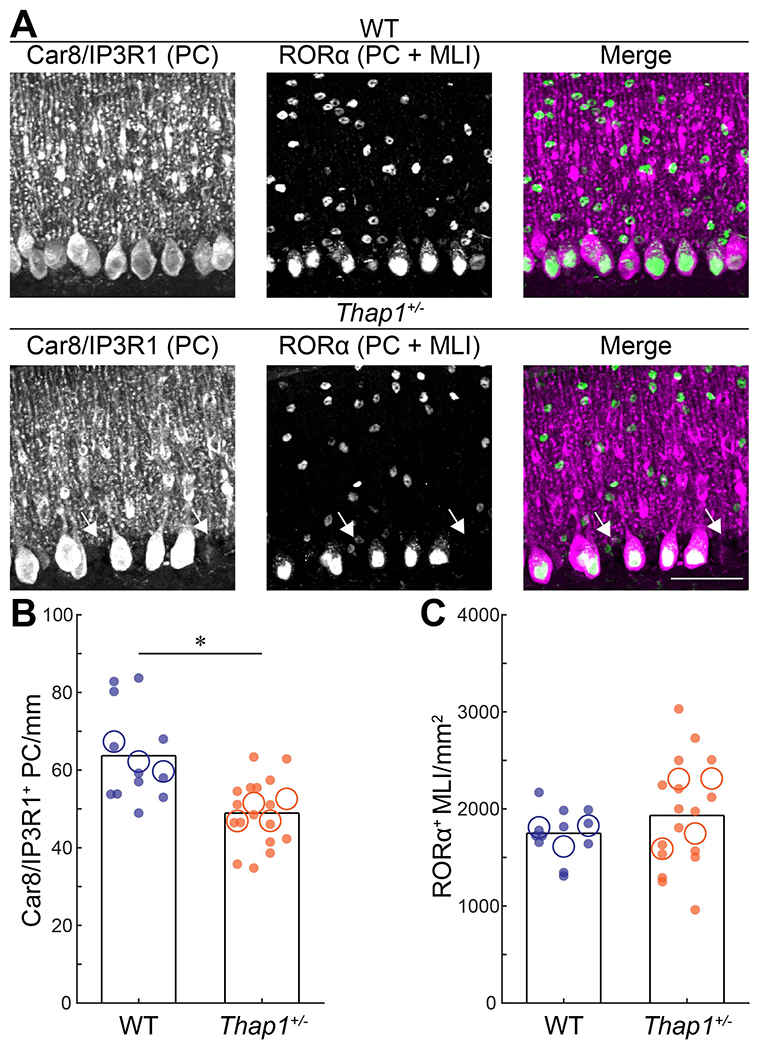
Figure 3: Thap1+/− mutant mice have a reduction in the number of Purkinje cells.

A. Representative images of Purkinje cells (PC) and molecular layer interneurons (MLIs) with a combination of Car8/IP3R1 (magenta) and RORα (green) in control (top) and Thap1+/− (bottom) mice. Arrows pointing at missing Purkinje cells. B. Neural density of Car8/IP3R1+ (PC) cells/mm, p=0.0005. C. Neural density of RORα cells/mm2, p=0.3275.
Definitions of summary statistics: Each large circle represents the mean for one mouse, whereas each dot represents one field of view. Bar height represents the mean of based on all cells for each genotype. Control: N=3 mice, n=12 sections; Thap1+/−: N=4 mice, n=17 sections. *p<0.05 as determined by a linear mixed model (LMM) with genotype as a fixed variable and mouse number as a random variable. All images were taken at same magnification, scalebar = 50 μm.
