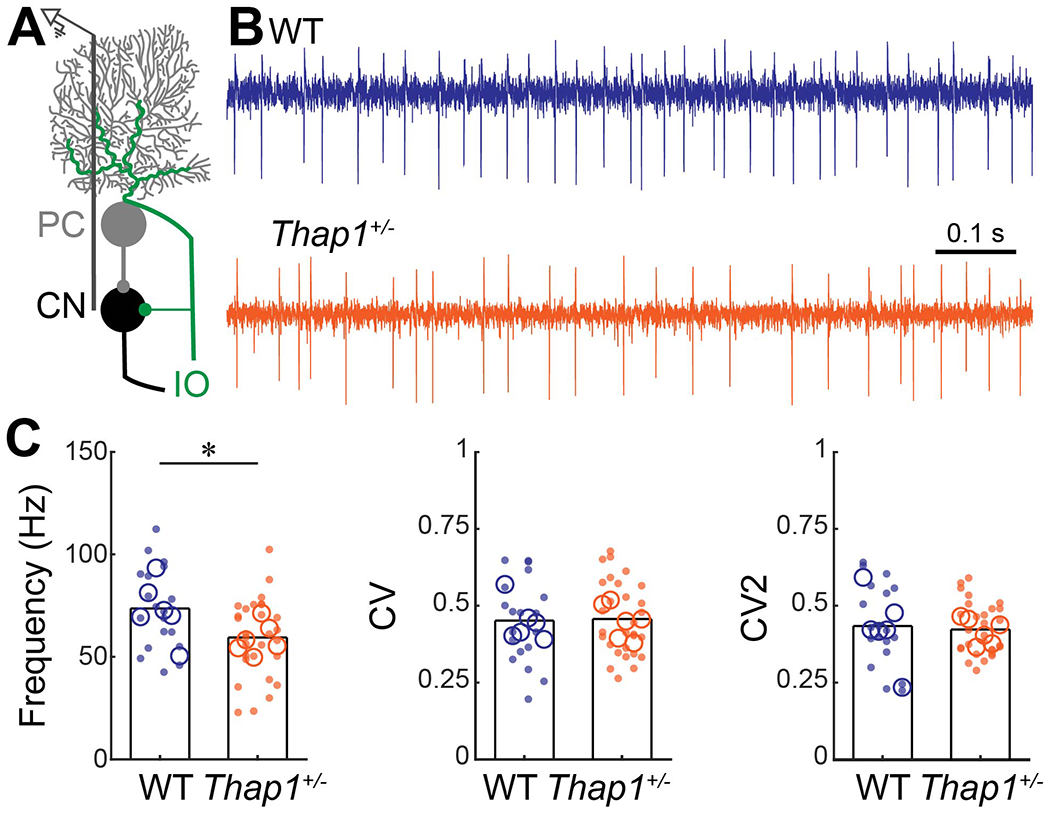
Figure 4: Cerebellar nuclei cells in Thap1+/− mice fire slower than control nuclei cells.

A. Schematic of extra-cellular recording from cerebellar nuclei cells in the cerebellar circuit. PC = Purkinje cell, CN = cerebellar nuclei, IO = inferior olive. B. Examples of electrophysiological recordings from cerebellar nuclei cells recorded from a control (top, blue) and Thap1+/− (bottom, orange) mouse traces are from cell that best represent the mean Frequency, CV, and CV2 for their genotype. C. Frequency, and global (CV) and local (CV2) irregularity of cerebellar nuclei firing patterns. Cerebellar nuclei cells in Thap1+/− mice fire significantly slower than control cerebellar nuclei cells. Frequency, p=0.0153; CV, p=0.8870; CV, p=0.7360.
Definitions of summary statistics: Each large circle represents the mean for one mouse, whereas each dot represents one nuclei cell. Bar height represents the mean of all cells for each genotype. Control: N=6 mice, n=17 cells; Thap1+/−: N=6 mice, n=28 cells. *p<0.05 as determined by a linear mixed model (LMM) with genotype as a fixed variable and mouse number as a random variable.
