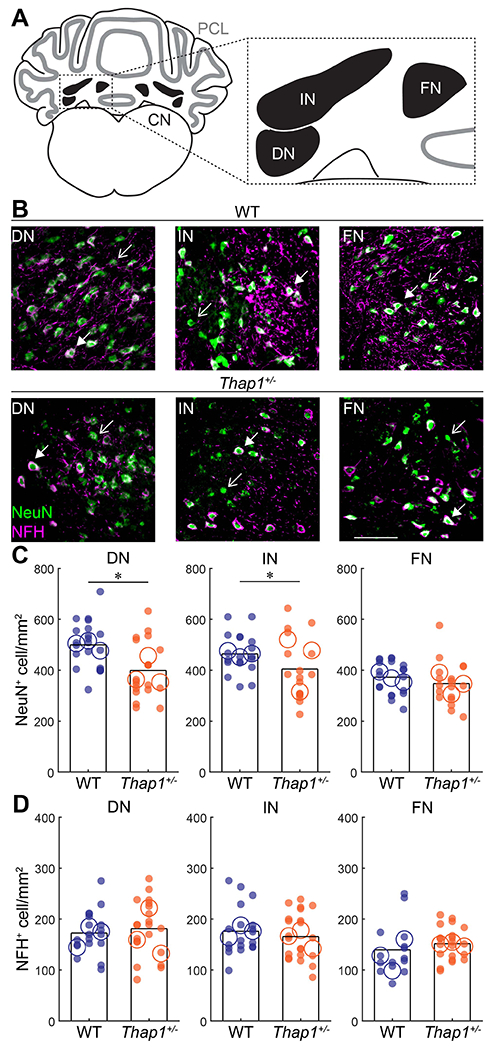
Figure 5: Thap1+/− mutants have a reduced number of cerebellar nuclei neurons but the number of excitatory projection neurons is preserved.

A. Schematic of a coronal section of the cerebellum with the Purkinje cell layer in gray and cerebellar nuclei in black. Inset shows the anatomical location of the dentate nucleus (DN), interposed nucleus (IN), and fastigial nucleus (FN). B. Representative images of DN, IN, and FN nuclei stained for the neuronal marker NeuN (green) and marker for large, excitatory projection neurons with NFG (magenta) in control (top) and Thap1+/− (bottom) mice. Open arrowheads indicate NeuN+/NFH− neurons; closed arrowheads indicate NeuN+/NFH+ neurons. C. Neural density of NeuN+ cells/mm2 in the DN, IN, and FN. A reduction in neuron number was observed in the DN and IN of Thap1+/− mice. DN, p=0.0129; IN, p=0.0206; FN, p=0.5279. D. Neural density of NFH+ cells/mm2 in the DN, IN, and FN is unaffected in Thap1+/− mice. DN, p=0.8447; IN, p=0.4772; FN, p=0.3679.
Definitions of summary statistics: Each large circle represents the mean for one mouse, whereas each dot represents one field of view. Bar height represents the mean of all cells for each genotype. Control: N=3 mice, n=15-20 sections; Thap1+/−: N=3 mice, n=17-22 sections. *p<0.05 as determined by a linear mixed model (LMM) with genotype as a fixed variable and mouse number as a random variable. All images were taken at same magnification, scale bar = 100 μm.
