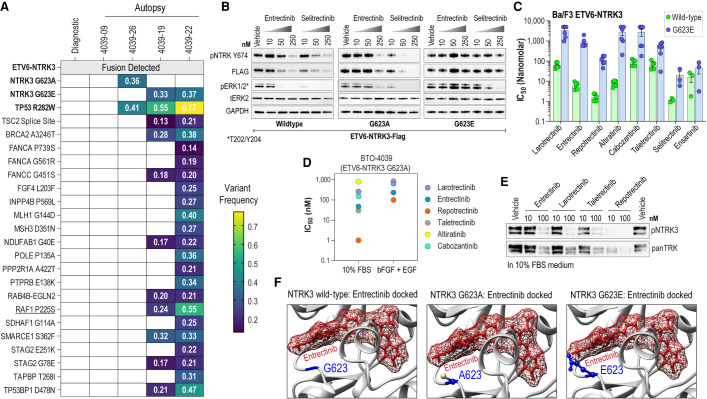
Figure 2.
Genetic analysis of tumors and in vitro characterization of identified NTRK3 mutations. (A) Variant allele frequency of identified mutations from GeneTrails next-generation sequencing of diagnostic and autopsy samples. (B) Immunoblot analysis of phosphorylated NTRK3, flag-tagged NTRK3, and phosphorylated and total ERK from transfected HEK293T17 cell lysates after 4 h of treatment with TKIs as indicated. (C) Bar graph of cell proliferation IC50 values for each of the indicated TKIs against Ba/F3 cells expressing wild-type ETV6-NTRK3 (green) and ETV6-NTRK3G623E (blue). (D) Scatter plot of cell proliferation IC50 values for indicated TKIs against patient cell line BTO-4039 expressing ETV6-NTRK3G623A cultured in 10% FBS media or neural stem cell media supplemented with bFGF and EGF. (E) Immunoblot analysis of phosphorylated NTRK3 and total NTRK3 from patient cell line BTO-4039 after 5 h of treatment with TKIs as indicated. (F) Predicted binding poses for entrectinib with NTRK3WT, NTRK3G623A, and NTRK3G623E.

