Figure 2.
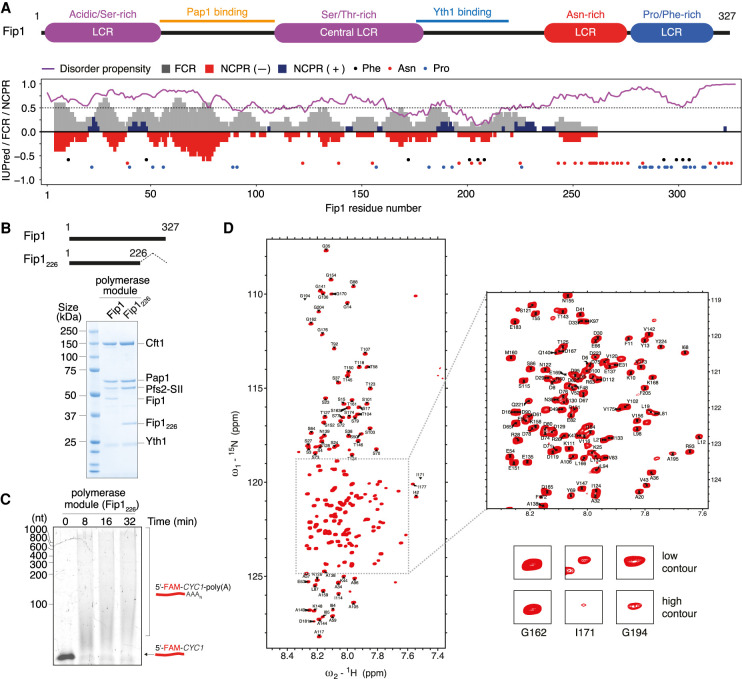
Fip1 residues 1–226 are sufficient for reconstitution of the polymerase module. (A) Domain diagram of Fip1 showing low-complexity regions (LCRs), Pap1-binding site, and Yth1-binding site (top), and bioinformatic analysis of the Fip1 sequence (bottom). In the plot, the purple line indicates IUPRED2 disorder prediction score. Residues with an IUPred value >0.5 (gray dotted line) are classified as having high propensity for being intrinsically disordered. Gray bars correspond to fraction of charged residues (FCR) over a sliding window of 10 residues. Red and blue bars represent net negative and positive charge per residue (NCPR), respectively, over the same window size. The colored circles highlight the distribution of phenylalanine (black), asparagine (red), and proline (blue) residues. (B) Schematic showing construct design of Fip1226 (residues 1–226; top) and SDS-PAGE of pull-down assays of a polymerase module using StrepII-tagged (SII) Pfs2 (bottom). (C) In vitro polyadenylation assay with a recombinant polymerase module containing Fip1226. A 42-nucleotide CYC1 3′ UTR with a 5′-FAM label was used as a substrate in the polyadenylation assay, and the reaction products were visualized on a denaturing urea polyacrylamide gel. This gel is representative of experiments performed twice. (D) 1H,15N 2D HSQC of 75 µM Fip1226 shown with the assignment of backbone resonances. The inset highlights a crowded region of the spectra. The bottom panels show examples of peaks. I171 and G194 show line broadening. BEST 1H,15N-TROSY spectra were acquired with four scans and a recycle delay of 400 msec, giving a final spectral resolution of 0.9 Hz per points in the indirect dimension and an experimental time of 20 min.

