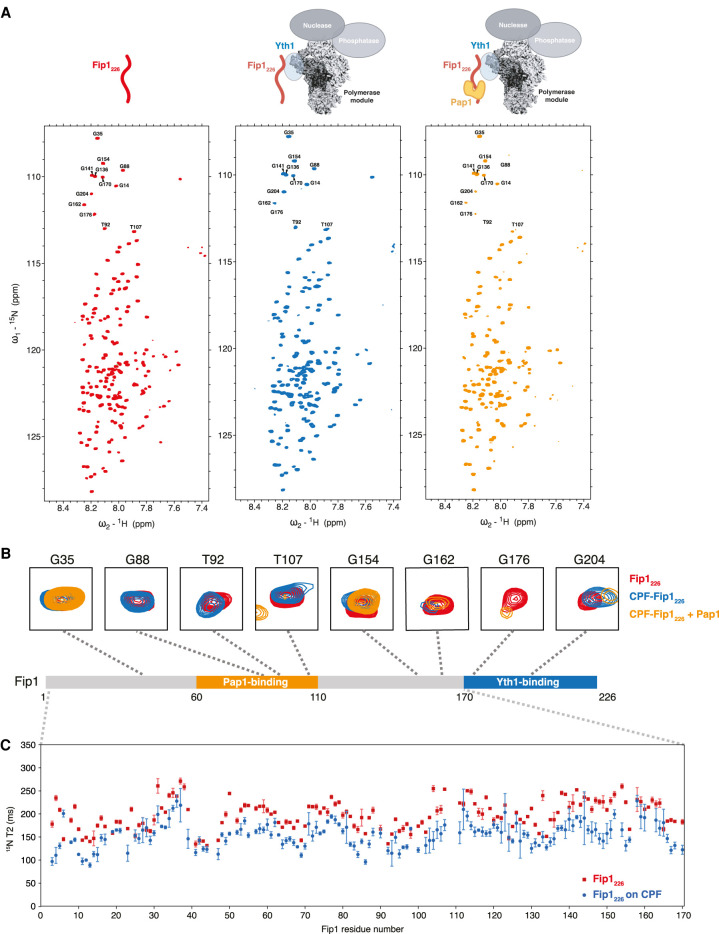
Figure 5.
The LCRs of Fip1226 are highly dynamic within the CPF complex. (A) 1H,15N 2D HSQC of Fip1226, alone (red, left) and bound to CPFΔFip1 (blue, middle) or CPFΔFip1 and Pap1 (orange, right). Schematic diagrams show the proteins included in each experiment. All spectra were collected at 950 MHz with 11 µM 13C,15N,2H Fip1226 in 150 mM NaCl buffer. Peaks analyzed in B are indicated in the spectra. BEST 1H,15N-TROSY spectra were acquired with 64 scans and a recycle delay of 400 msec, giving a final spectral resolution of 2.2 Hz per point in the indirect dimension and an experimental time of 142 min. (B) Selected Fip1226 peaks for all three samples. Perturbation or line broadening of peaks specific to the defined regions for Yth1 and Pap1 binding was observed upon interaction with CPFΔFip1 and Pap1. Peaks are mapped onto a diagram of the Fip1226 protein. Colors as in A. (C) T2 relaxation data for the first 170 residues of Fip1226 alone (red) and incorporated into CPFΔFip1 (blue).

