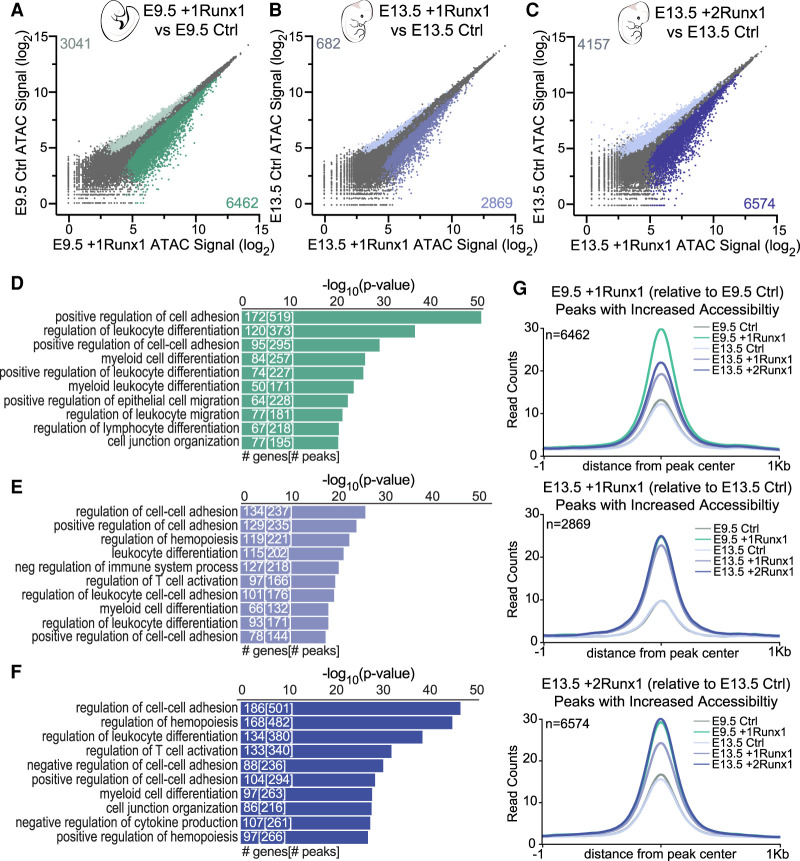
Figure 3.
RUNX1 increased chromatin accessibility at hematopoietic genes in both embryonic and fetal ECs. (A–C) Scatter plot of ATAC-seq peak signals for a consensus peak set following RUNX1 induction for E9.5 +1Runx1 (A), E13.5 +1Runx1 (B), and E13.5 +2Runx1 (C). Coloring and peak number are based on differential peaks calculated using EdgeR (FDR < 0.05). (D–F) GO biological process terms for peaks with increased accessibility (relative to Ctrl) for E9.5 +1Runx1 (D), E13.5 +1Runx1 (E), and E13.5 +2Runx1 (F). Peak regions were linked to genes using GREAT. The top 10 terms are shown. Numbers in bars represent the number of genes and peaks/regions for each GO term. (G) Averaged peak profile plots (normalized to reads per genomic content [RPGC]) of peaks with increased accessibility (shown in plots as n) following RUNX1 relative to Ctrl at each time point for E9.5 +1Runx1, E13 .5 +1Runx1, and E13.5 +2Runx1.

