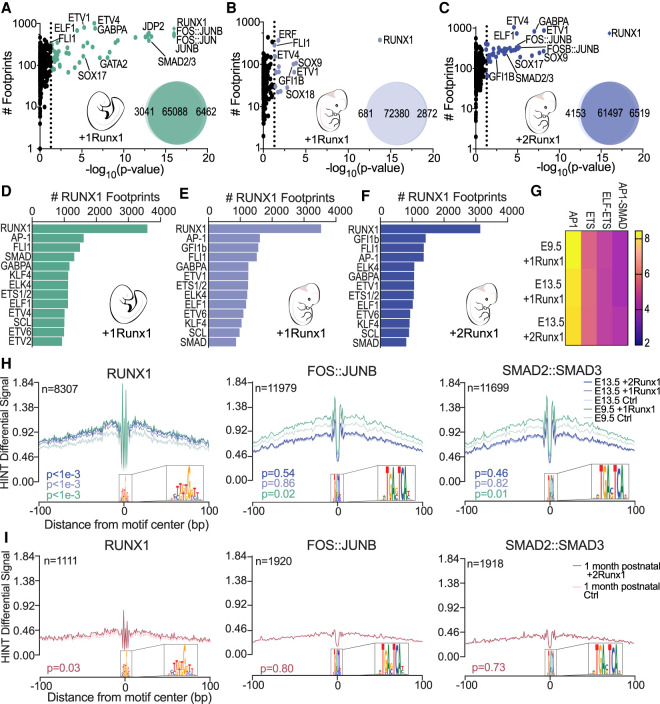
Figure 5.
Colocalization of RUNX1, AP-1, and SMAD footprints is a determinant of efficient HEC specification. (A–C) Scatter plots showing enriched TF footprints at regions of chromatin with increased accessibility (relative to Ctrl at each time point) for E9.5 +1Runx1 (A), E13.5 +1Runx1 (B), and E13.5 +2Runx1 (C). The number of footprints for each TF at regions of chromatin with increased accessibility is displayed on the Y-axis for the +Runx1 condition. (Diamonds) P-value ≪ 1 × 10⁻¹⁶, (colored circles) P < 0.05. P-values calculated using biFET. Venn diagrams represent the number of peaks closed (left), unchanged (middle), and opened (right) following RUNX1 induction in each sample. (D–F) TF footprints co-occurring (±200 bp) with RUNX1 footprints shown as number of RUNX1 footprints for E9.5 +1Runx1 (D), E13.5 +1Runx1 (E), and E13.5 +2Runx1 (F). (G) Top combination of motifs enriched near RUNX1 footprints; select pairs are shown. Scale is Z-score calculated using potentially collaborating transcription factor finder (PC-TrAFF). AP-1 and ETS refer to combinations of the respective TF family members. (H,I) RUNX1 (left), FOS:JUNB (middle), and SMAD2:SMAD3 (right) footprint plots following RUNX1 induction for embryonic and fetal ECs (H) and 1-mo postnatal ECs (I). Plots show average normalized read counts calculated using HINT differential around all footprints in all samples. (n) Number of nonredundant footprints. P-values shown are relative to each time point Ctrl and were calculated using HINT differential.

