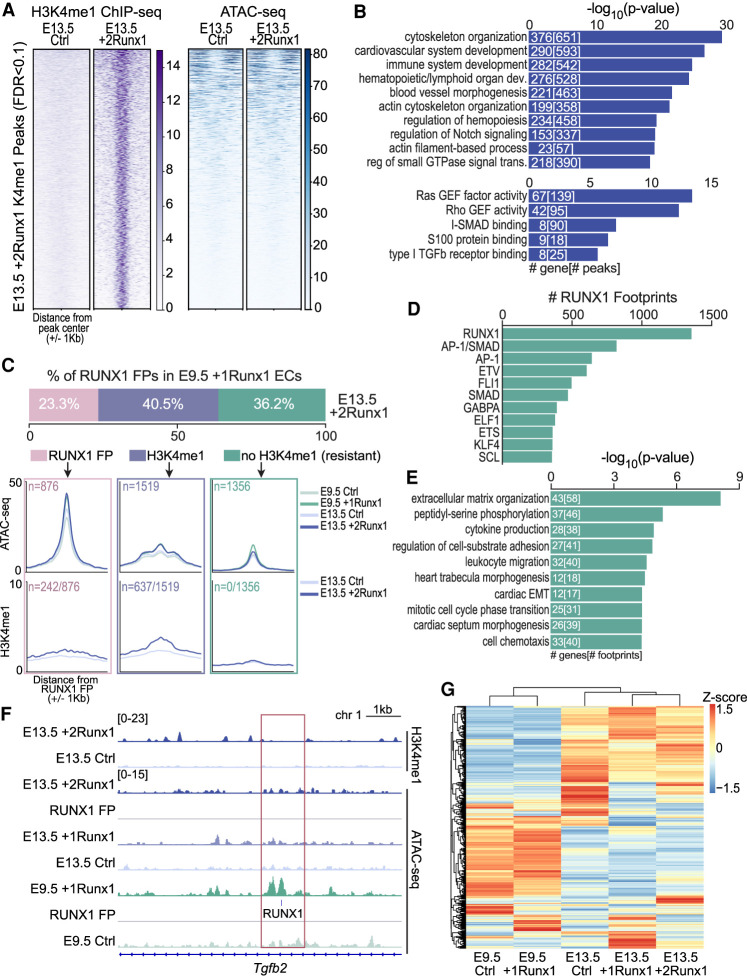
Figure 6.
RUNX1 primes regulatory regions in fetal ECs that are active in embryonic ECs. (A) Heat maps of H3K4me1 (left, purple) and ATAC-seq (right, blue) signals (scales are normalized to RPGC read counts) for 5398 regions newly marked (FDR < 0.1) by H3K4me1 following RUNX1 induction in E13.5 +2Runx1 ECs. (B) The top 10 biological process terms (top graph), and top five molecular function terms (bottom graph) associated with H3K4me1 peaks gained in E13.5 +2Runx1 ECs. The numbers of genes and peaks associated with each term are overlaid on the bars. (C) Annotation of the RUNX1 footprints found in E9.5 +1Runx1 ECs and in E13.5 +2Runx1 ECs. The top bar graph shows footprints in E9.5 +1Runx1 ECs binned based on their status in E13.5 +2Runx1 ECs. Categories include RUNX1 footprints present in E13.5 +2Runx1 ECs (pink), no RUNX1 footprint in E13.5 +2Runx1 ECs but marked by H3K4me1 (±500 bp) (lavender), or no H3K4me1 (or RUNX1 footprint) in E13.5 +2Runx1 ECs (±500 bp) (green). The top metagene plots show ATAC-seq signal, and the bottom metagene plots show H3K4me1 signal at these regions. In the top plots, n represents the total number of regions plotted for both ATAC-seq and H3K4me1 plots, and in the bottom panel, n represents the number of regions that were marked by new H3K4me1 in E13.5 +2Runx1 relative to E13.5 Ctrl ECs shown as a fraction of all regions. Colored boxes around metagene plots signify same-colored regions as shown in the bar plot above. (D) The number of RUNX1 footprints with co-occurring (±200 bp) TF footprints in E9.5 +1Runx1 ECs that were not present or marked by H3K4me1 in E13.5 +2Runx1 ECs (“resistant”; boxed in green in C). (E) GO terms for “resistant” genes. The top 10 terms are shown; numbers in bars represent the number of genes and footprints/regions for each GO term. (F) Genome browser view showing normalized H3K4me1 signal in E13.5 +2Runx1 and Ctrl ECs (top), normalized ATAC-seq signal in E13.5 +2Runx1, E13.5 +1Runx1, E13.5 Ctrl, E9.5 +1Runx1, and E9.5 Ctrl ECs, and RUNX1 footprint (RUNX1; denoted by small blue box) in the Tgfb2 locus. (G) Expression of genes from E, represented as a heat map based on RNA-seq data normalized to FPKM and shown as a Z-score for each gene.

