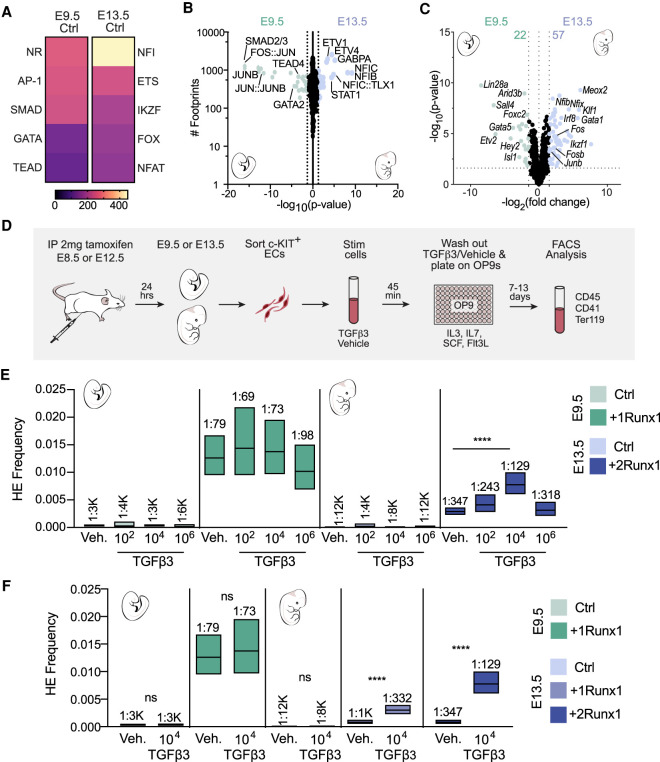
Figure 7.
Activation of TGFβ signaling cooperates with RUNX1 to increase the efficiency of hemogenic specification of fetal ECs. (A) Heat maps of the top five enriched TF motif families in differentially accessible peaks between E9.5 and E13.5 Ctrl. Score is −log10(adjusted P-value) calculated using MEME AME. (B,C) Scatter plots of TF footprints enriched (B) and volcano plot of differentially expressed TFs (C; FDR < 0.05 and FC > |1.5|) between E9.5 Ctrl (left) and E13.5 Ctrl (right). For B: (diamonds) P-value ≪ 1 × 10⁻¹⁶, (colored dots) P < 0.05. P-value was calculated using biFET. (C) Colored dots and numbers represent differentially expressed TFs. (D) Schematic illustrating the isolation of ECs, ex vivo stimulation with TGFβ3, and limiting dilution assays for quantification of HEC frequency. (E,F) Frequency of HECs (±95% CI) in c-KIT+ ECs following stimulation with 102, 104, or 106 molecules of TGFβ3 per cell or vehicle (E), and 104 molecules of TGFβ3 per cell or vehicle (F). HEC frequencies are indicated above the bars. Data represent four biological replicates using pooled cells from litters of E9.5 Ctrl and +1Runx1 embryos collected in six independent experiments, and four (E13.5 +1Runx1) and five (E13.5 +2Runx1) biological replicates from E13.5 litters collected in 11 independent experiments. Significance was determined using ELDA software.

