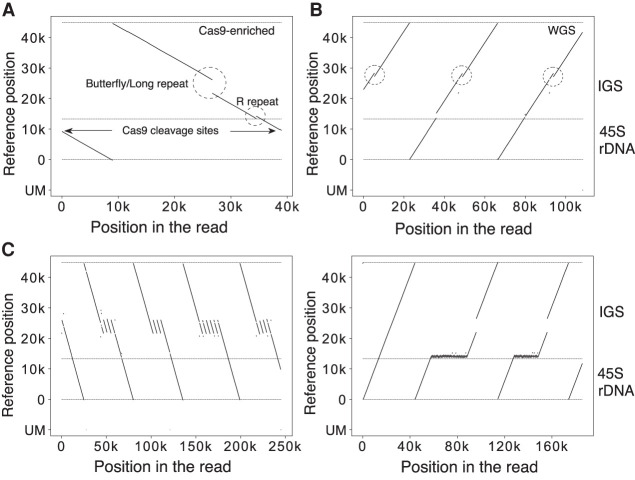
Figure 2.
Visualization examples. (A,B) Representative visualization pattern of a read obtained from Cas9-enrichment (A) and whole-genome (B) sequencing. The vertical axis is the mapped position in the reference; the horizontal axis is the position in the Oxford Nanopore read. The horizontal dashed lines indicate the end of the reference and the border between 45S rDNA and IGS. The unmapped split reads are shown at the bottom (UM). The Sal box and the Butterfly/Long repeat region, which show variability among copies, are indicated (A). The same type of IGS variation is seen in all three rDNA copies (dashed circles) (B). (C) rDNA copies with an extremely long Butterfly/Long and R repeat. This kind of R repeat expansion was seen in four individuals (HG01258, HG02080, HG02257, PSCA0047); for all of them, multiple copies of R repeat expansion were detected. These sequences cannot be analyzed by short-read sequencers.

