Figure 4.
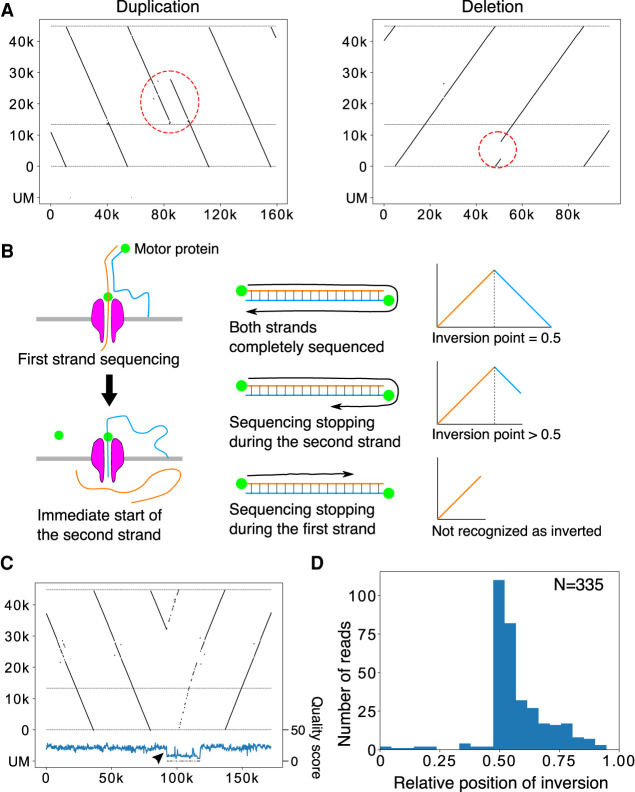
Large-scale structural variation in the rDNA array. (A) Representative reads with large-scale variation in the rDNA array. (Left panel) The R to Butterfly/Long repeat region is doubled. (Right panel) A large portion of rDNA in the 45S rDNA is deleted. (B) The mechanism of Nanopore template switching that causes artifactual “fake” palindromic reads. (Left panel) After the completion of first strand sequencing, second (complementary) strand sequencing sometimes occurs. (Right panel) When sequencing terminates randomly after strand switching, the resulting distribution of the inversion points in the reads should be seen in only the latter half of the reads. (C) A representative palindromic read. The structure and the end points of the read are similar before and after the inversion point, although the read is relatively long. The Phred quality scores plotted below were smoothed by binning and averaging. A sudden drop in quality score is observed just after the inversion point (arrowhead). (D) Plot of the relative position of inversion in each read for HPGP samples. The distribution is peaked at the center and heavily skewed to the latter half of reads, suggesting that most of the palindromic reads are artifacts.

