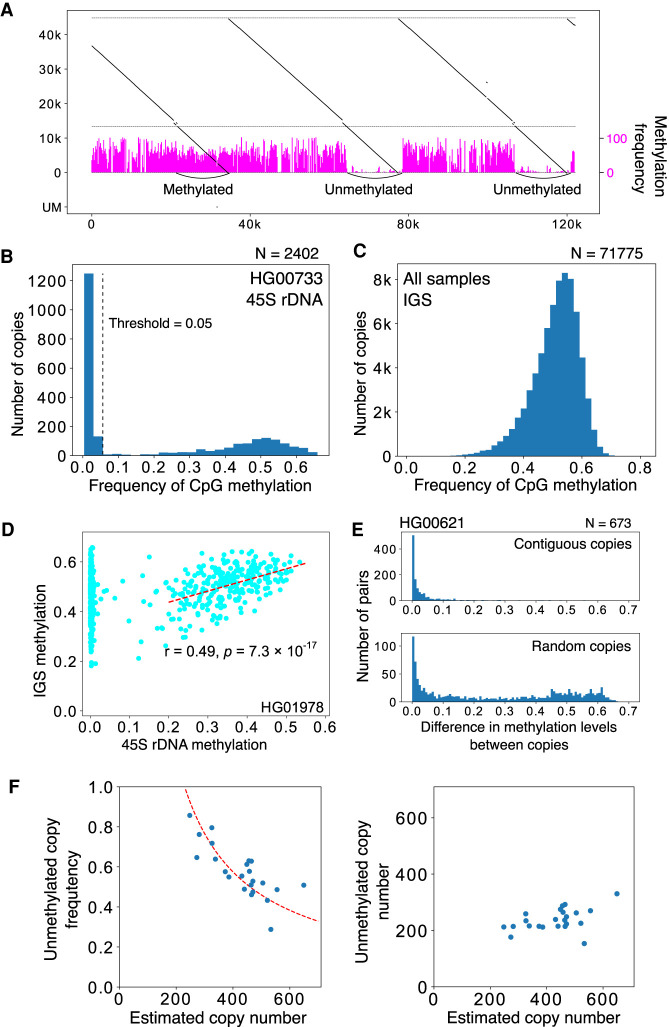
Figure 5.
Methylation analysis of rDNA. (A) Representative visualization of CpG methylation. Reads are split into 200-nt bins, and the expected frequency of CpG methylation is calculated for each bin using posterior probability output by Guppy basecaller. The methylation frequency of each bin is shown as a vertical magenta bar. In the read shown, both the methylated and less methylated 45S rDNA are included. The three IGS methylation patterns are similar despite the difference in the 45S rDNAs. (B) Average proportion of methylated CpG for each 45S rDNA (calculated by taking the mean of posterior probabilities), and distribution in the HG00733 sample. The dashed line indicates the border between the less methylated copies and methylated copies. (C) Proportion of CpG methylation in the IGS in all samples. Most of the IGS copies are heavily methylated. (D) Methylation level of 45S rDNA and its flanking IGS. In many samples, there is a clear correlation for copies with highly methylated 45S rDNA (dashed line). (E) Differences in the methylation levels of contiguous 45S rDNAs and randomized controls. The methylation pattern is similar between adjacent copies of contiguous 45S rDNA, as in the case of repeat number variation in the IGS (Fig. 3C). (F) Relationship between the estimated rDNA copy number and the proportion of unmethylated copies (left) or the estimated number of unmethylated copies (right). The dashed line in the left panel is a theoretical line based on the assumption that the number of active rDNA copy is constant at 230.

